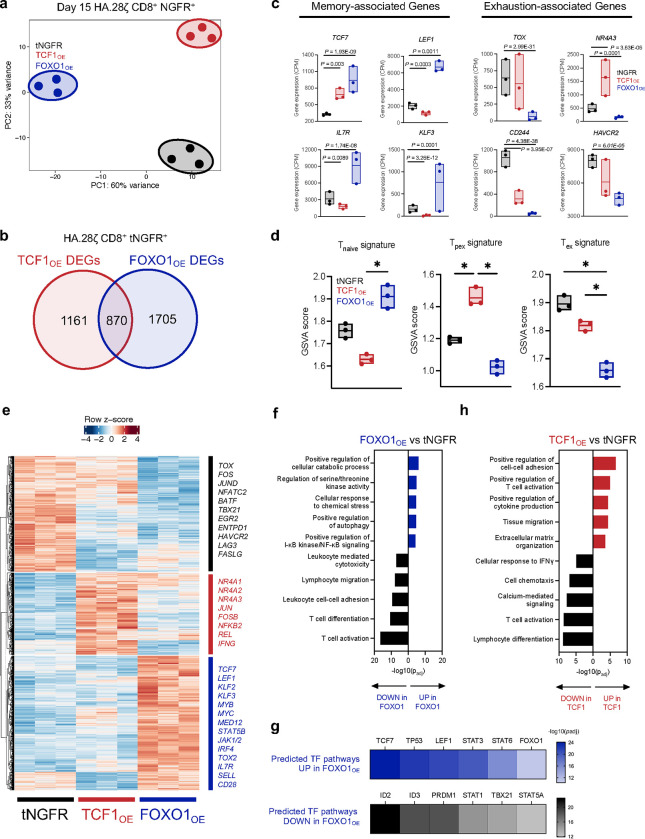
Figure 3. Overexpression of FOXO1, but not TCF1, induces a memory-like transcriptional program.
a-h, Bulk RNA-sequencing analyses of day 15 tNGFR-purified CD8+ HA.28ζ CAR T cells overexpressing tNGFR (black), TCF1 (red), or FOXO1 (blue) (n = 3 donors). a, Unbiased principal component analysis (PCA). b, Venn diagram showing the number of unique and shared differentially expressed genes (DEGs) in TCF1OE and FOXO1OE cells compared to tNGFR cells (adjusted P < 0.05 with log2(fold change) 0.5). c, Expression of memory- (left) and exhaustion-associated (right) genes. Center line represents the mean counts per million of 3 donors. d, Gene set variation analysis (GSVA) using naive, progenitor exhausted, and exhausted T cell signatures from Andreatta et al66. e, Heatmap and hierarchical clustering of DEGs. Genes of interest are demarcated and colored based on the condition in which they’re upregulated. f, Gene ontology (GO) term analyses showing curated lists of top up- and downregulated processes in FOXO1OE cells (left) TCF1OE cells (right) versus tNGFR controls. g, QIAGEN Ingenuity Pathway Analysis (IPA) of upregulated and downregulated transcription factor pathways in FOXO1OE cells versus tNGFR controls. c, Paired analyses using DESeq2. d, One-way ANOVA with Tukey’s multiple comparisons test. *, P < 0.05.

