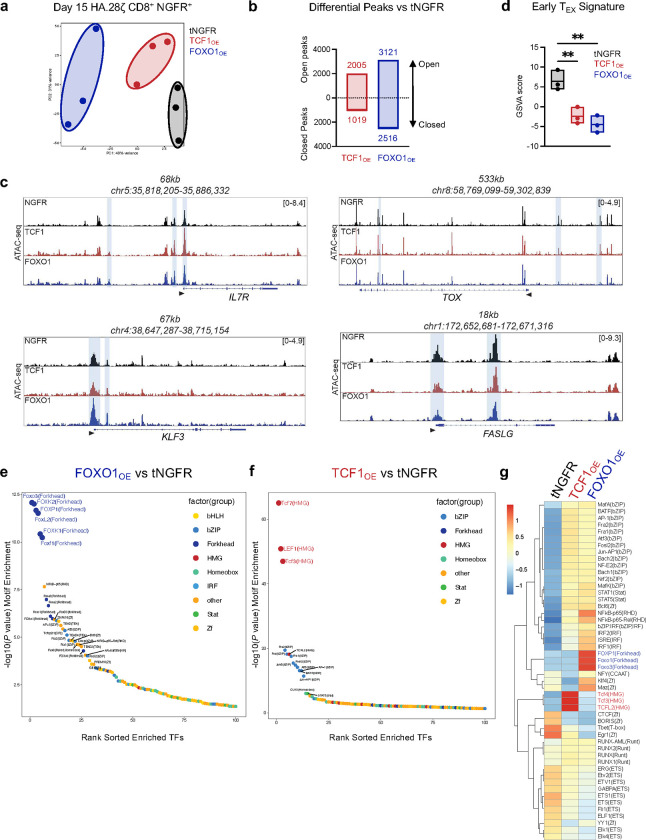
Figure 4. FOXO1 and TCF1 overexpression induce chromatin remodeling at their putative DNA-binding motifs.
a-g, Bulk ATAC-sequencing analyses of day 15 tNGFR-purified CD8+ HA.28ζ CAR T cells overexpressing tNGFR (black), TCF1 (red), or FOXO1 (blue) (n = 3 donors). a, Principal component analysis (PCA). b, Differential open and closed peaks compared to tNGFR controls c, Chromatin accessibility tracks at IL7R, TOX, KLF3, and FASLG loci for a representative donor. d, Enrichment of an early exhausted T cell chromatin accessibility signature based on ATAC-seq data from Satpathy et al.9 Center line represents the mean of 3 donors. e,f, Rank ordered plot of differentially accessible transcription factor binding motifs in FOXO1OE cells (e) and TCF1OE cells (f) versus tNGFR controls. Transcription factor families are annotated by color. g, Heatmap and hierarchical clustering of mean differential motif accessibility. Scale shows normalized z-scores for each motif.

