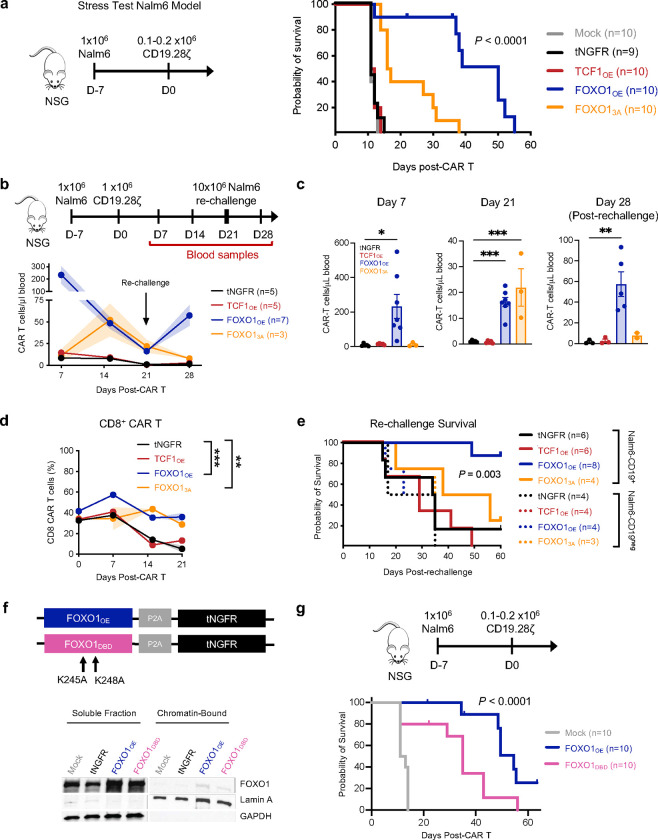
Figure 5. FOXO1 overexpression enhances CAR T cell expansion, persistence, and antitumor activity in leukemia xenograft models.
a, A subcurative dose of 0.1–0.2×10⁶ tNGFR-purified CD19.28ζ CAR T cells were infused into Nalm6 leukemia-bearing mice 7 days post-engraftment. Stress test Nalm6 model schematic (left) and survival curve (right) are shown (P < 0.0001 log-rank Mantel-Cox test). Data are from 2 donors (n = 4–5 mice per condition). b-d, A curative dose of 1×10⁶ tNGFR-purified CD19.28ζ CAR T cells overexpressing tNGFR (black), TCF1 (red), FOXO1 (blue), or FOXO13A (orange) were infused into Nalm6 leukemia-bearing mice 7 days post-engraftment. Mice were rechallenged with 10×106 Nalm6 leukemia cells on day 21 post-CAR T cell infusion (b, top). b,c,d Quantification of human CD45+ CAR T cells in peripheral blood harvested on days 7, 14, 21, and 28 (b,c) and percent CD8+ CAR T cells (d) by flow cytometry. Plots show mean ± s.e.m. of 3–7 mice per group from 1 representative donor (n = 2 donors). e, Kaplan-Meier curve depicting survival of mice after rechallenged with CD19+ or CD19- Nalm6 leukemia cells (P = 0.003, log-rank Mantel-Cox test). Combined data from two donors are shown (n = 3–8 mice per group). f, Schematic depicting construct design and amino acid substitutions to generate human FOXO1DBD (pink, top) and Western blots of indicated proteins in soluble and chromatin-bound fractions isolated from day 8 post-activation tNGFR-purified CD19.28ζ CAR T cells (bottom). g, Schematic of CD19.28ζ stress test Nalm6 model (as shown in a) comparing mock and FOXO1-WT- or FOXO1-DBDmut-overexpressing CAR T cells (above) and survival curve (below) (P < 0.0001, log-rank Mantel-Cox test). Combined data from two donors are shown (n = 10 mice per group, data from 1 donor is also included in a).

