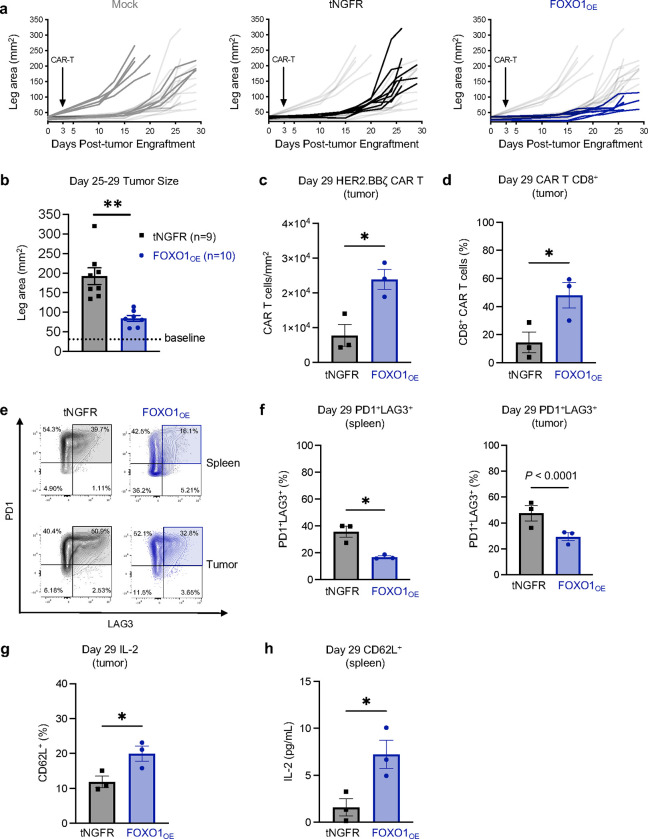
Figure 6. FOXO1OE CAR T cells exhibit improved antitumor activity in a solid tumor xenograft model.
5×10⁶ Her2.BBζ CAR T cells were infused into 143B osteosarcoma-bearing mice 3 days post-engraftment. a-b Tumor growth of individual mice treated with mock (grey), tNGFR (black), or FOXO1OE (blue) cells. Combined temporal data from 2 donors is shown in (a) (n = 8–9 mice per group) and at a selected timepoint between day 25–29 (n = 7–8 mice per group). c-h, Tumors and spleens were harvested and processed for phenotypic and functional assays on day 29 post-engraftment (1 donor, n = 3 mice per group). c, Total tumor-infiltrating CAR T cells. d, Percent CD8+ tumor-infiltrating CAR T cells. e,f, Exhaustion marker expression from splenic and tumor-infiltrating CAR T cells. Contour plots show 1 representative mouse and bar graphs show mean ± s.e.m. of 3 mice per group. g, CD62L expression from splenic CAR T cells h, IL-2 secretion after ex vivo stimulation with cultured 143B. Data shows the mean ± s.e.m. of 3 mice. b-d, f-h, unpaired two-sided student’s T test. *, P < 0.05; **, P < 0.01.

