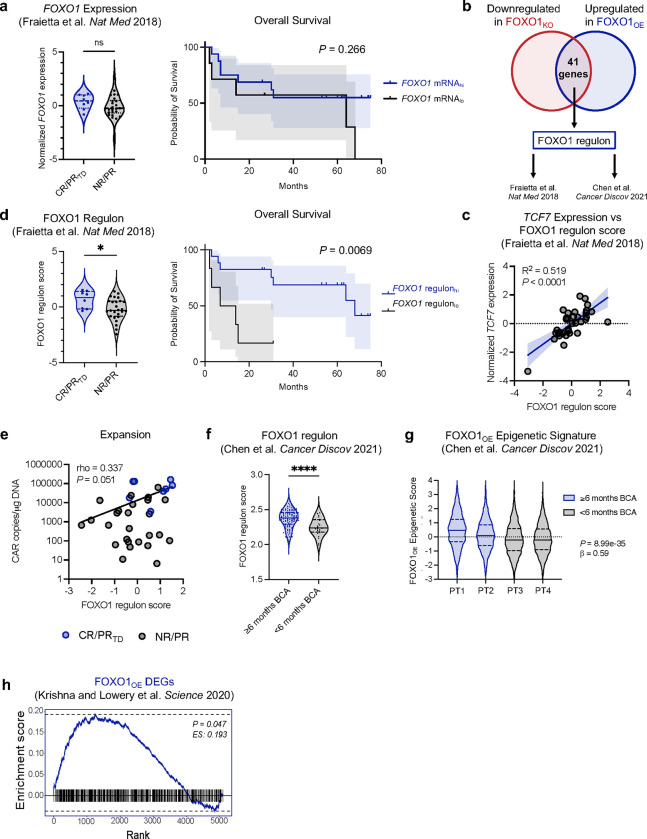
Figure 7. FOXO1 activity correlates with clinical response to CAR T and TIL therapy.
a-d, Single-sample gene set enrichment analyses (GSEA) were performed on RNA-sequencing data generated from ex vivo CAR-stimulated patient CTL019 T cells published in Fraietta et al.3 (complete responder, CR, n = 5; partial responder with transformed disease, PRTD, n = 3; partial responder, PR, n = 5; non-responder, NR, n = 21). a, FOXO1 transcript did not correlate with response to CAR T (left) or overall survival (right). b, An empiric gene signature representing the FOXO1 regulon (Table 1) was then applied to the same data set. c, Simple linear regression showing the correlation between TCF7 expression and FOXO1 regulon score. Dots shown are individual CTL019 patient samples and shaded area indicates 95% confidence intervals. d, FOXO1 regulon scores significantly correlated with response (left), overall survival (right), and e, trended with CAR T peak expansion. f, Single-sample GSEA analyses on RNA-sequencing data from pediatric B cell acute lymphocytic leukemia (B-ALL) patient-apheresed effector T cells which were subsequently manufactured with CD19.BBζ and infused into patients6. The FOXO1 regulon was enriched in patients who exhibited durable CAR T persistence (≥6 months B cell aplasia, BCA; n = 33 patients) compared to those with short persistence (< 6 months BCA, n = 27 patients). g, Epigenetic signatures derived from differentially accessible peaks (P < 0.05) in CD8+ CD19.28ζ FOXO1OE and TCF1OE cells (Fig. 3 and Extended Data Fig. 5) were applied to scATAC-seq data generated from B-ALL apheresed patient T cells published in Chen et al.6 The FOXO1OE-derived epigenetic signature was significantly enriched in cells from two patients with durable CAR T persistence (≥6 months BCA, Patient 52, n = 616 cells; Patient 54, n = 2959 cells) compared to those with short persistence (< 6 months BCA, Patient 38, n = 2093 cells; Patient 66, n = 2355 cells). h, GSEA analyses were performed with CD8+ HA.28ζ FOXO1OE differentially expressed genes (DEGs, Fig. 3) and DEGs from CD39−CD69− patient TIL that correlated with TIL therapy responses in adult melanoma from Krishna and Lowery et al.8 a, Mann-Whitney test (left); Mantel-Cox test (right); d,f, Mann-Whitney test; e, Spearman correlation; g, Wald test of a linear regression model.

