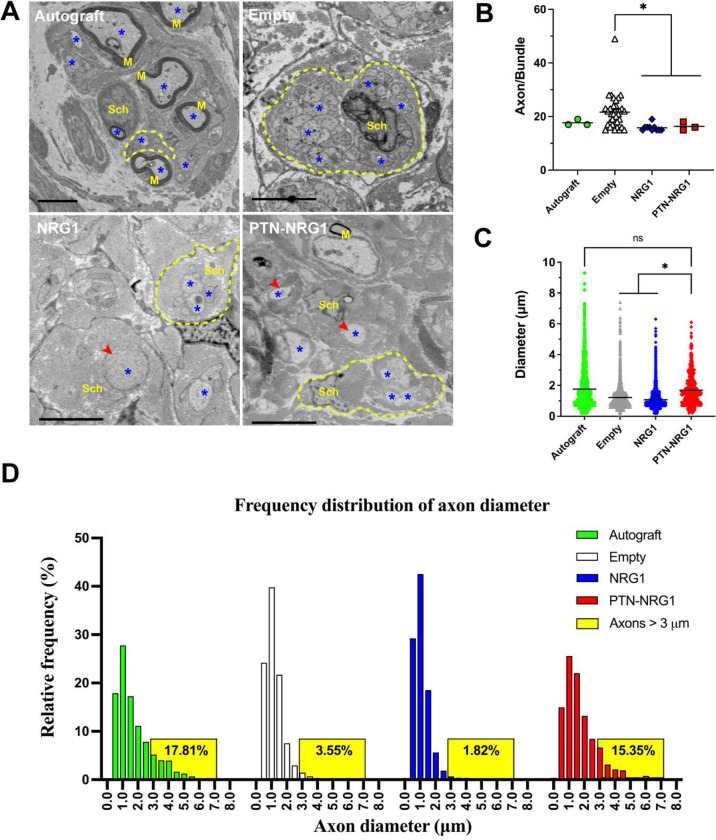
Figure 6. NRG1 promotes remyelination.
A, Toluidine blue staining of the regenerated tissue Scale bar: 200 μm. B, TEM images of the myelinated axons in the distal end of regenerated nerves. Scale bar: 5 μm. C, Average number of remyelinated axons observed per view field. D, Diameter of the remyelinated axons. E, Analysis of g-ratios for remyelinated axons observed in each group. One-way ANOVA was used to compare means between groups. *, p<0.05; ****, p<0.0001; ns, p>0.05.

