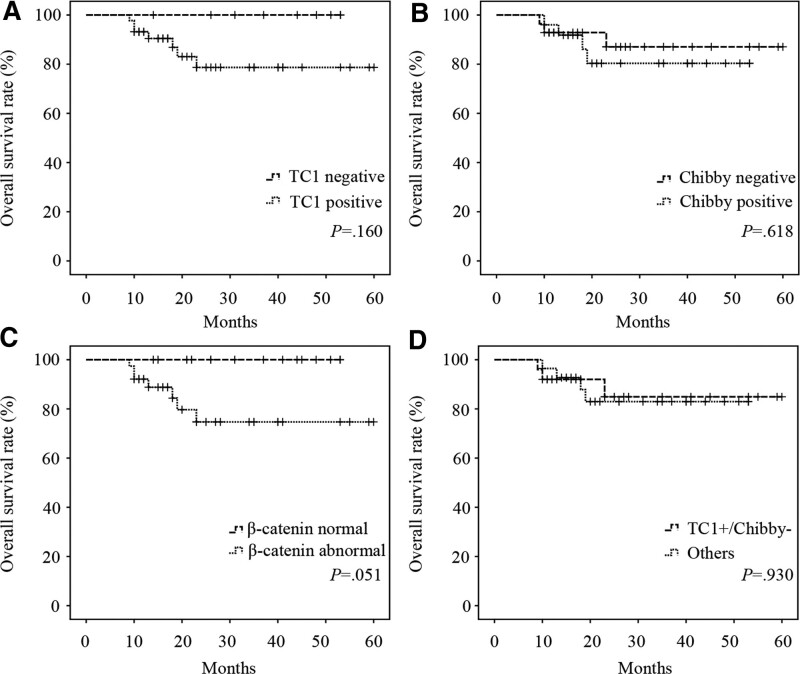
Figure 4.
Correlations between TC1, Chibby, β-catenin and overall survival rate in LSCC patients. Kaplan–Meier overall survival curves of “TC1 negative” and “TC1 positive” group (A), “Chibby negative” and “Chibby positive” group (B), “β-catenin normal” and “β-catenin abnormal” group (C), and “TC1+/Chibby−” and “Others” group (D) from LSCC patients. “Others” represented the groups of TC1+/Chibby+, TC1-/Chibby−, and TC1-/Chibby+. Curves for survival rates were determined by the Kaplan–Meier analysis and compared using the log-rank test. P value of <.05 was considered statistically significant. LSCC = laryngeal squamous cell carcinoma, TC1 = thyroid cancer 1, TC1+/Chibby− = positive expression of TC1 and negative expression of Chibby.

