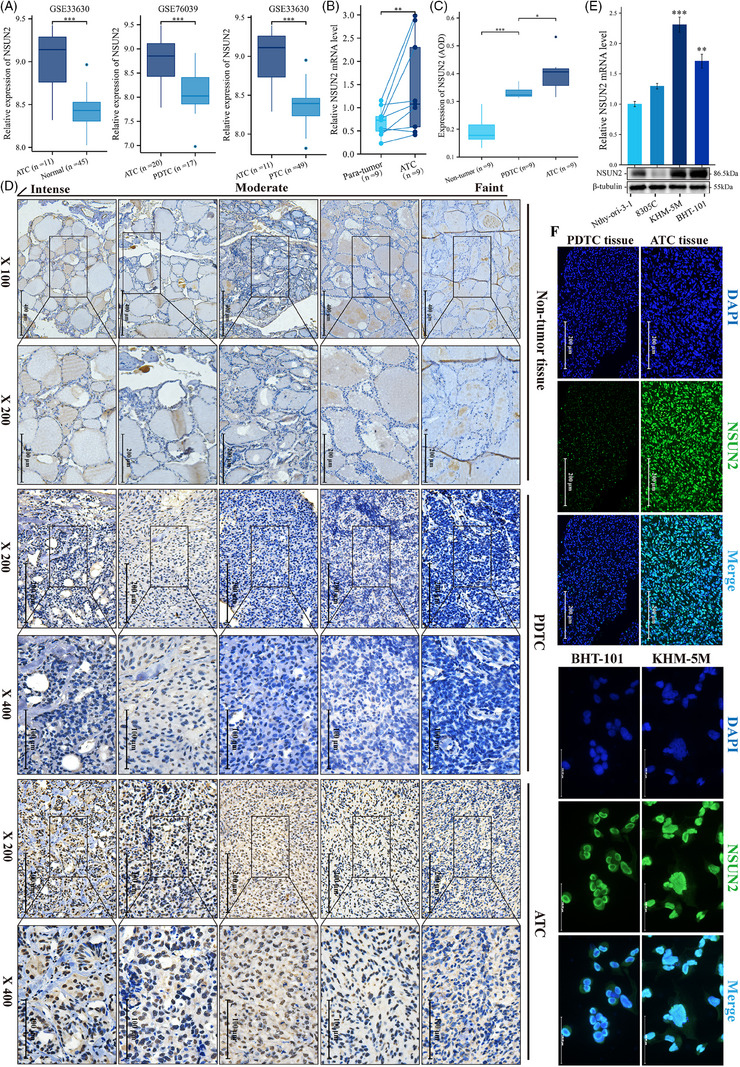
FIGURE 1.

Expression of NSUN2 in anaplastic thyroid cancer. (A) Box plots showing the expression of NSUN2 between ATC and normal, PDTC or PTC samples from two different publicly available RNA‐seq datasets GSE33630 and GSE76039. (B) qRT‐PCR showing the relative expression of NSUN2 in ATC (n = 9) and paired para‐tumour tissue (n = 9). Wilcoxon signed rank test, p = 0.008. (C) Quantification of NSUN2 staining in normal thyroid, PDTC and ATC tissue by average optical density (AOD). Tukey HSD test. (D) IHC staining for NSUN2 in normal thyroid, PDTC and ATC tissue. Grouped by faint, moderate and intense staining. (E) qRT‐PCR and WB showing the relative expression of NSUN2 in ATC and normal thyroid cell lines. Wilcoxon signed rank test. (F) IF staining showed NSUN2 (green fluorescence) located in nuclear.
