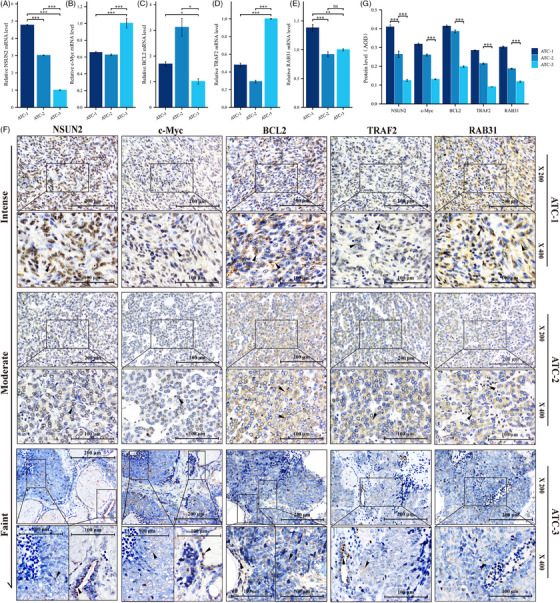
FIGURE 7.

The correlation between NSUN2 and the expression of representative genes was also verified in ATC tissues. (A–E) qRT‐PCR analysis showed that there was no obvious correlation between c‐Myc (B), TRAF2 (C), BCL2 (D), RAB31 (E) and NSUN2 (A) mRNA levels in ATC tissues. (F) The ATC tissues were arranged according to the expression level of NSUN2 protein, and those with low expression of NSUN2 tended to have lower protein levels of c‐Myc, TRAF2 and RAB31. (G) Quantification of IHC staining in ATC tissue by average optical density (AOD), ANOVA.
