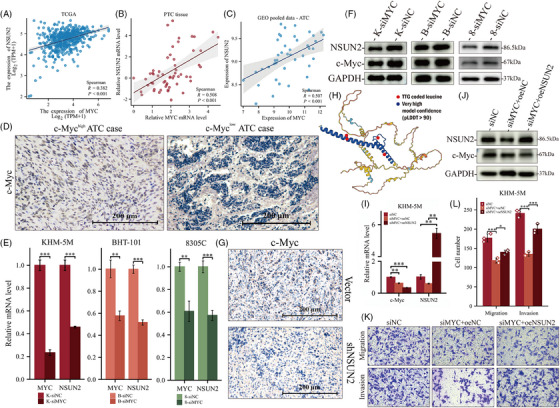
FIGURE 9.

NSUN2 levels are regulated by c‐Myc, and the malignancy caused by c‐Myc can be partly performed by NSUN2. (A–C) Association between c‐Myc and NSUN2 in thyroid cancer. (A) PTC RNA‐seq data obtained from TCGA database. (B) PTC patients’ tissue from Xiangya Hospital. (C) ATC RNA‐seq pooled data from GSE33630, GES65144 and GSE76039. (D) IHC staining of c‐Myc in ATC tissue derived from Figure 1D. Scale bars, 200 μm. (E and F) qRT‐PCR (E) and WB (F) validated NSUN2 was down‐regulated upon c‐Myc knockdown in all ATC cell lines used in this article. (G) IHC staining of c‐Myc in tumours samples in xenograft mice model from Figure 4. Scale bars, 200 μm. (H) Three‐dimensional structure from AlphaFold (predicted) for c‐Myc protein. The blue part indicates very high model confidence (pLDDT > 90). The red dots indicate leucine encoded by TTG in c‐Myc protein. (I and J) Validation of c‐Myc knockdown and NSUN2 overexpression for rescue assay. (K and L) Transwell assay (K) and statistical analysis (L) showing that overexpression of NSUN2 partly rescued the decreased migration and invasion upon c‐Myc knockdown.
