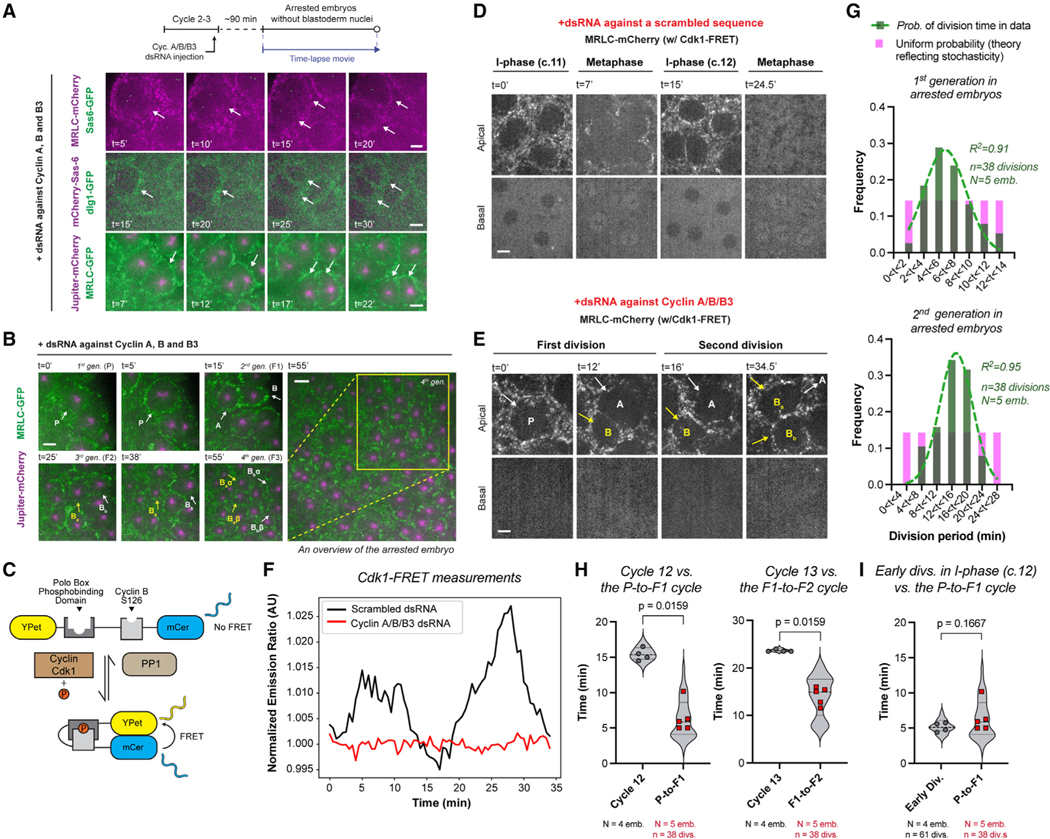
Figure 3. Cytoplasmic divisions can occur periodically without the nucleus and mitotic CDK/cyclin complexes, and they can do so faster than nuclear divisions.

(A) Cyclin A-B-B3 triple cocktail dsRNA injection in embryos that express (top) MRLC-mCherry and Sas-6-GFP; (middle) mCherry-Sas-6 and dlg1-GFP (plasma membrane); (bottom) MRLC-GFP and Jupiter-mCherry (n = 9 embryos). Illustrated by white arrows, see the formation and division of compartments without nuclei—judged by the complete lack of nuclear shadows basally, as successfully done before using the nuclear retention of otherwise cytoplasmic proteins10 (see Figure S3A for validations).
(B) Cytoplasmic divisions continue in arrested embryos, yielding multiple generations (see for example, P to B, then to Ba and Bb, then to Baα, Baβ, Bbα, and Bbβ).
(C) Cartoon diagram for an established Cdk1/Protein Phosphatase 1 (PP1) FRET biosensor31,32 (see STAR Methods).
(D) Micrographs illustrate cell cycles in regular embryos expressing Cdk1-FRET and MRLC-mCherry, injected with a scrambled dsRNA sequence.
(E) Autonomous cytoplasmic divisions in embryos expressing the same markers as in (D) but with cyclin A/B/B3 dsRNAs.
(F) Cdk1/PP1 FRET dynamics were quantified directly from time-lapse videos depicted in (D) and (E) (see STAR Methods), representative from n = 3 embryos in each condition.
(G) Graphs show the period distributions in the first and second generations of cytoplasmic divisions in arrested embryos (green bars), after the initial emergence of cytoplasmic compartments. The data are distributed normally with a defined center, as opposed to a uniform distribution (theoretical pink bars) that implicates stochasticity. R2 values indicate the goodness of Gaussian fit in green.
(H) Violin plots compare autonomous cytoplasmic division period (red data points) with the period of nuclear divisions at corresponding blastoderm stages in control embryos (gray data points).
(I) Violin plot compares autonomous cytoplasmic division period (red data points) with the time of early cytoplasmic divisions in the interphase of scrambled dsRNA embryos (gray data points).
Analyses (G)–(I) were performed on embryos expressing MRLC-GFP and Jupiter-mCherry under indicated conditions. Each data point (H) and (I) represents an embryo (N), whose distributions are indicated with quartile lines derived from the underlying cytoplasmic division data (n) and a probability density estimation using the kernel plot. Statistical significance was assessed using a Welch’s t test (for Gaussian distributed data) or a Mann-Whitney test. Scale bars, 5 μm.
See also Figure S3.
