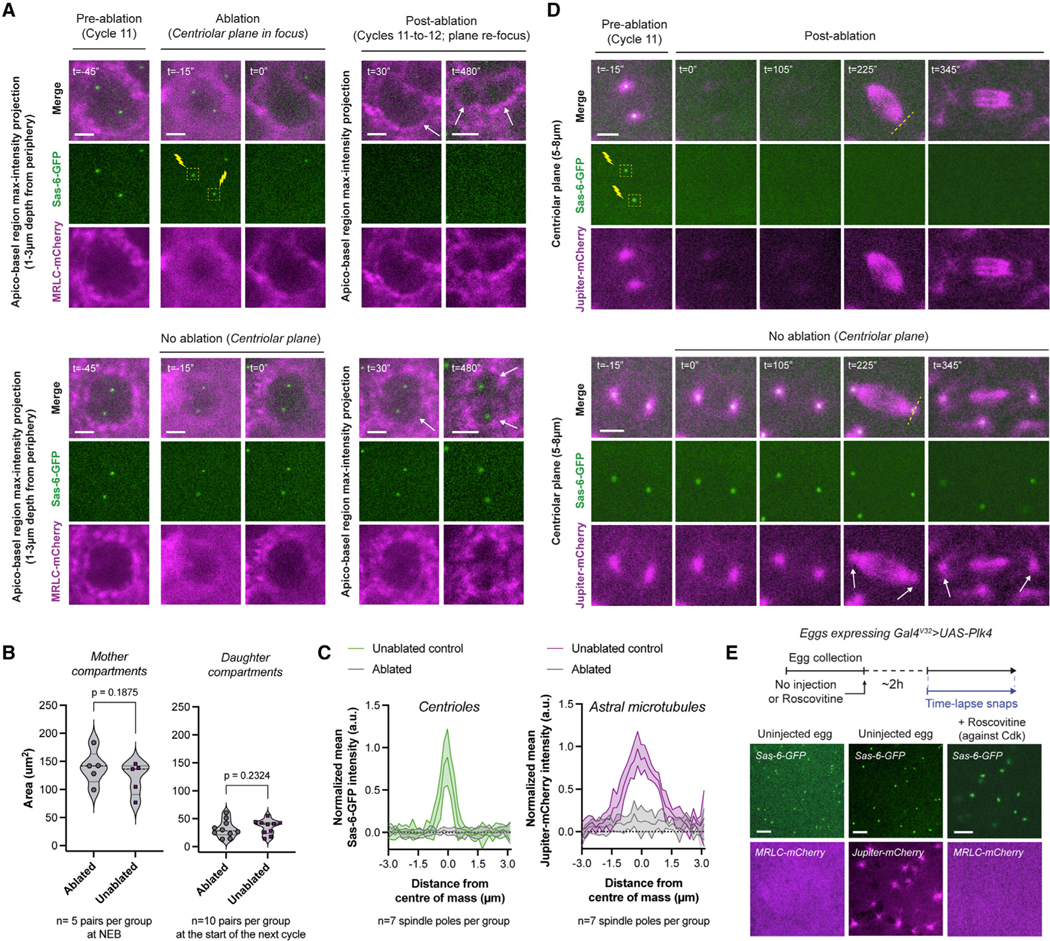
Figure 4. Centrosomes are neither necessary nor sufficient to trigger cytoplasmic divisions in developing fly embryos.

(A) Micrographs depict compartments (MRLC-mCherry) where the centrioles (Sas-6-GFP) were ablated in early interphase (top) or were uninterrupted (bottom). Successful ablations (n = 5 embryos) were judged by the elimination of Sas-6-GFP and its persistent absence. See further controls on inadvertent or intentional bleaching in Figures S5A and S5B. Cytoplasmic compartments without centrioles continue to divide (top panels with white arrows).
(B) Violin plots compare cytoplasmic compartment sizes immediately after ablation in cycle 11 (left), or immediately after their divisions (cycle 12) to compare their progeny sizes (right).
(C) Radial profiles of the normalized mean Sas-6-GFP (centriole) and Jupiter-mCherry (astral MT) intensity values from mitotic spindle poles under indicated ablation conditions in (D).
(D) An experiment mimicking (A) but performed in embryos expressing Sas-6-GFP and Jupiter-mCherry (n = 4 embryos). White arrows (bottom) highlight the intact centrosomes and astral MTs. Dashed yellow lines (top) signify the regions used for radial profiles depicted in (C).
(E) Images illustrate de novo centriole formation in unfertilized eggs, either unperturbed (left and middle; n = 5 and 11, respectively) or +Roscovitine (n = 9). See Figures S4D–S4F for their time-lapse snapshots.
Each data point in (B) represents a single compartment (n), whose distributions are indicated with quartile lines and a probability density estimation using the kernel plot. Data in (C) are represented mean ± SD. Statistical significance was assessed using a Welch’s t test (for Gaussian distributed data) or a Mann-Whitney test. Scale bars, 5 μm.
See also Figures S4 and S5.
