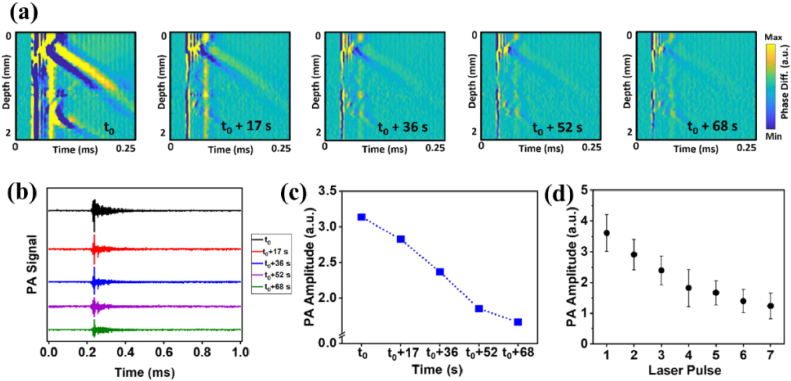
Fig. 4.
Successive laser excitations at the same location in sample 5 at ∼120 mJ/cm2 laser fluence. (a) The sequence of spatiotemporal displacement maps of repetitive excitations of NBs. (b) Corresponding PA signals after sequential laser pulses. (c) Changes in PA signal amplitude over sequential laser excitations of NBs. (d) Variations of the PA signal from five different measurements (each at a different location) with seven consecutive laser pulses at each position. The error bar is the standard deviation of the inter-position averages.

