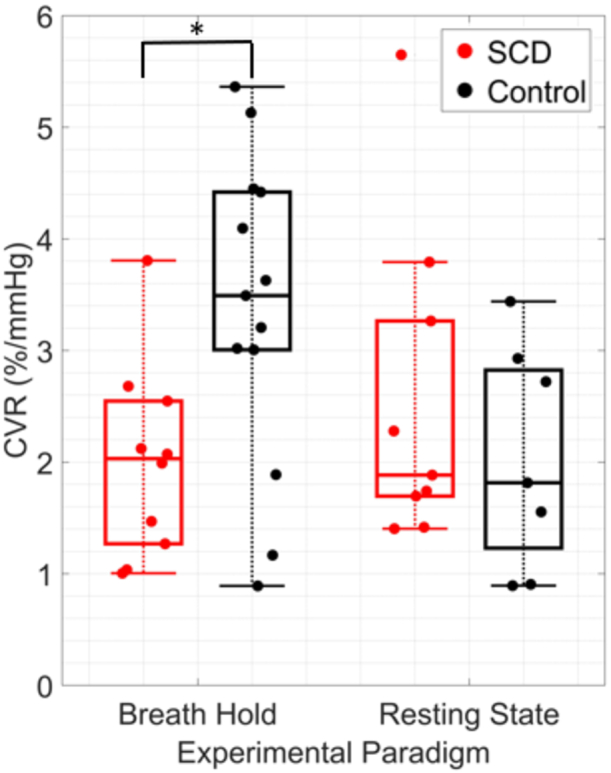
Fig. 3.

Cerebrovascular reactivity (CVR) by group and experimental paradigm. Boxplots of CVR (%/mmHg) in sickle cell disease (SCD, red) and control (black) groups during breath-hold (left) and resting state (right) experimental paradigms. For each boxplot, the central line denotes the median, the bottom and top edges of the box indicate the 25th and 75th percentiles, respectively, and whiskers extend to the most extreme data not considered outliers. Individual dots represent each participant. *p < 0.05; significance between groups was assessed using a Wilcoxon rank-sum test.
