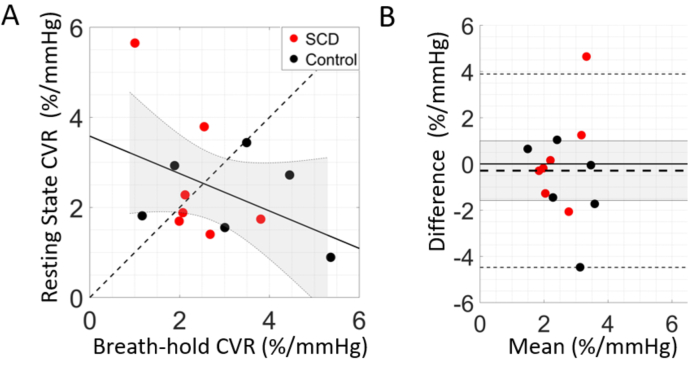
Fig. 5.
Agreement between cerebrovascular reactivity (CVR) paradigms. (A) CVR assessed during breath-hold versus resting state paradigms (N = 13). The dotted line represents the line of unity, the solid line represents the best linear fit, and the shaded grey region denotes the 95% confidence interval. (B) Bland-Altman plot of the mean CVR between resting state and breath-hold versus the difference. Mean bias is denoted by the horizontal thick dotted black line along with its 95% confidence interval (shaded gray region), line of equality (solid thick black line), and limits of agreement (thin dotted black lines).

