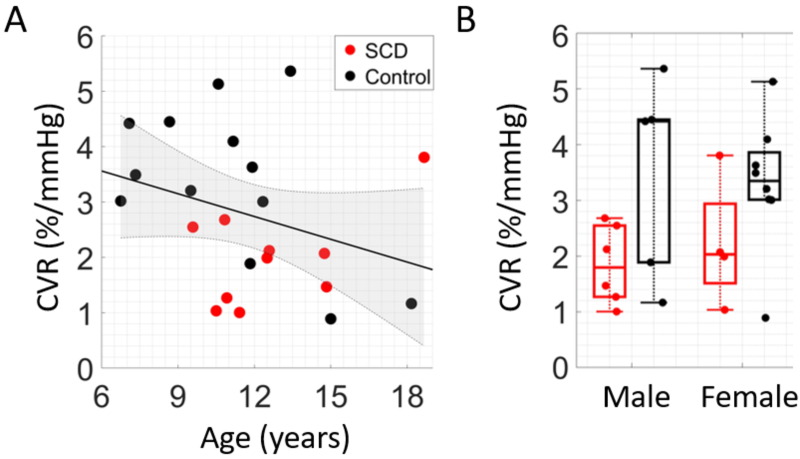
Fig. 6.
Association between breath-hold cerebrovascular reactivity (CVR) and demographic factors. (A) Relationship between breath-hold CVR and age. Data points are color coded by group (red = SCD, black = control, N = 23). The solid line (black) represents the best linear fit and shaded region (gray) represents the 95% confidence interval. (B) Boxplot of CVR differences between sexes for SCD (red) and healthy controls (black).

