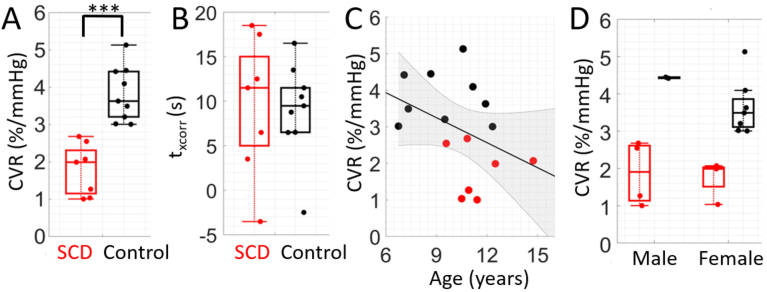
Fig. 7.
Subgroup analysis in participants with enhanced brain-sensitivity. Breath-hold paradigm results from individuals with average resting state . A) Boxplot of cerebrovascular reactivity (CVR, %/mmHg) in sickle cell (SCD, N = 7) and control (N = 9) groups. *** denotes p < 0.001; significance was assessed with a Wilcoxon rank-sum test. B) Boxplots of , the time lag that yielded the highest correlation coefficient between blood flow and end tidal CO2 timeseries. (C) Relationship between CVR and age. The solid line (black) represents the best linear fit and shaded region (gray) represents the 95% confidence interval. (D) Boxplot of CVR in males vs. females. In all plots, red denotes SCD and black denotes controls.

