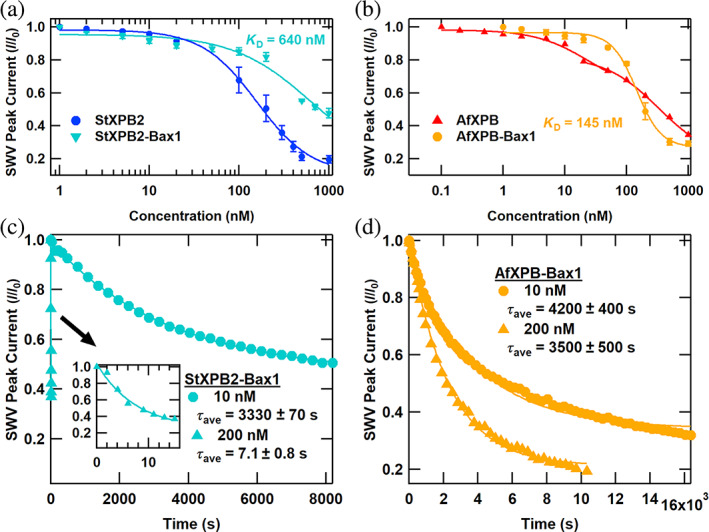
FIGURE 6.

Binding and kinetics of helicase‐Bax1 complexes. (a) Normalized square wave voltammetry (SWV) peak current versus helicase concentration for helicases from Sulfolobus tokodaii (StXPB2) (Figure 4 data) and StXPB2‐Bax1 (no ATP was added). (b) Normalized SWV peak current versus helicase concentration for Archaeoglobus fulgidus helicases (AfXPB) (Figure 4 data) and AfXPB‐Bax1 (no ATP was added). (c) Normalized SWV peak current versus time after ATP addition for electrochemically active DNA monolayers treated with various concentrations of StXPB2‐Bax1 helicase. (d) Normalized SWV peak current versus time after ATP addition for electrochemically active DNA monolayers treated with various concentrations of AfXPB‐Bax1 helicase. Symbols indicate the data, solid curves are first‐order exponential decay fits to the data, and decay times are presented as average ± standard error of the mean for at least three trials.
