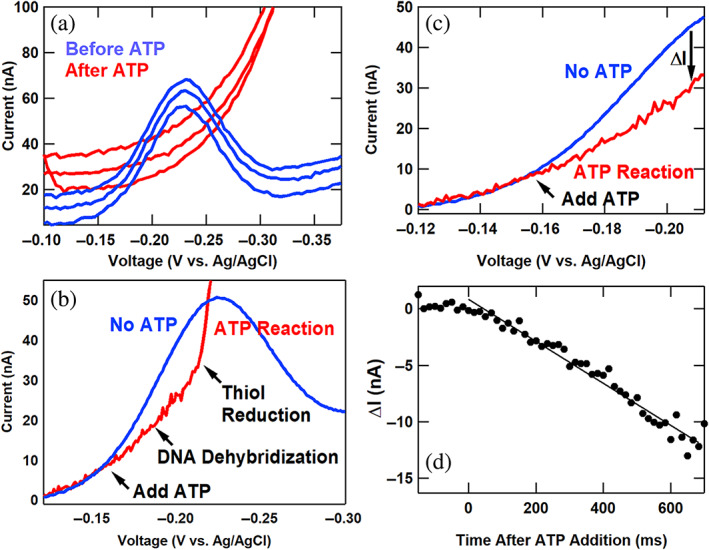
FIGURE 7.

Catastrophic loss of DNA electrochemical signal under ATP‐induced acidic conditions with insufficient buffering. (a) Successive square wave voltammetry (SWV) sweeps before and after ATP addition. (b) A SWV curve from 25 SWV scans before ATP addition (blue) and a curve recorded during ATP addition (red). (c) The SWV curves of Figure 7b focused on the region between −0.120 and −0.212 V versus Ag/AgCl. (d) The difference in current between the red and blue curves of Figure 7c is plotted against time after ATP addition, showing the quantifiable rapid signal loss.
