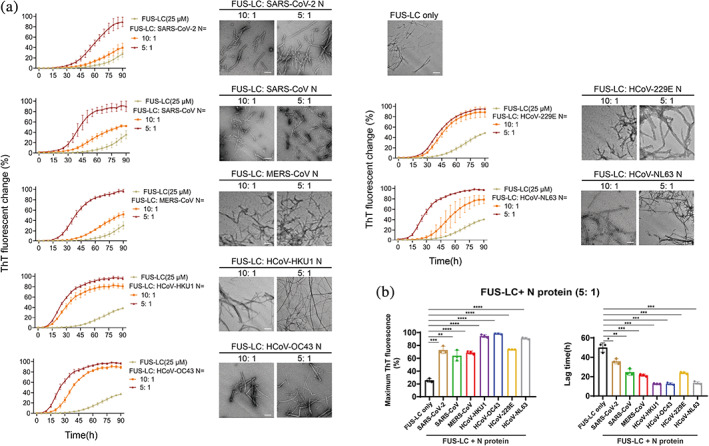
FIGURE 4.

N protein promotes amyloid aggregation of FUS‐LC. (a) ThT kinetic assay and NS‐TEM image of amyloid fibril formation of FUS‐LC. Protein concentration of FUS‐LC and the molar ratio of FUS: N protein is indicated. Buffer for FUS‐LC amyloid formation: 50 mM Tris–HCl, pH 7.5 and 150 mM NaCl, 50 μM ThT and 0.05% NaN3. Data are shown as mean ± SD with n = 3 independent replicates. TEM images of samples were taken at the time point of 90 h incubation. Scale bar, 200 nm. (b) Comparison of seven N proteins on their ability to promote FUS amyloid aggregation. Maximum ThT fluorescence intensity after 90 h incubation (left) and the lag time (right) of fibrillation of 25 μM FUS‐LC in the presence of 5 μM N protein is shown. Data are shown as mean ± SD with n = 3 independent replicates. Student's t test, *p < 0.05; **p < 0.01; ***p < 0.001; ****p < 0.0001.
