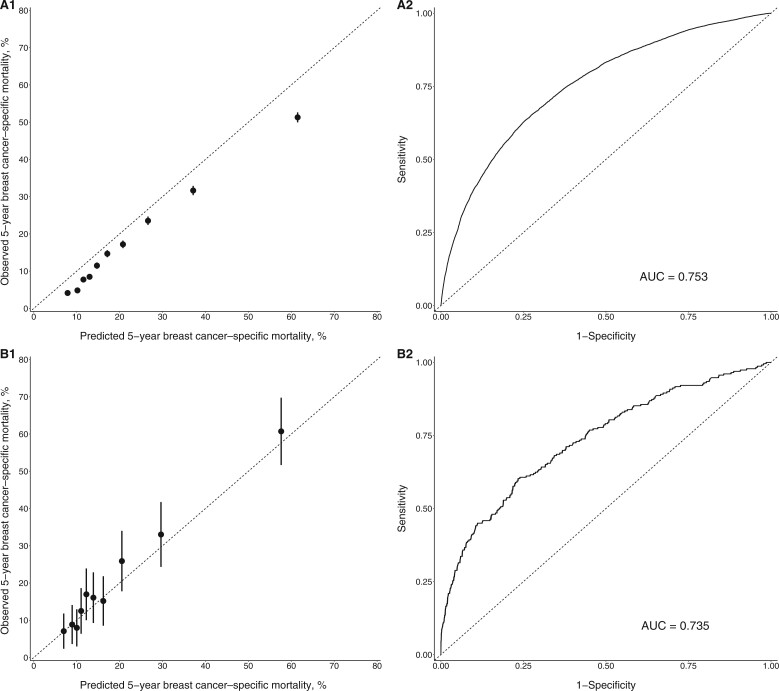
Figure 2.
Calibration plot (A1 and B1) and receiver operating characteristic curve (A2 and B2) for estrogen receptor–negative breast cancer. A1 and A2 are for first breast cancers. B1 and B2 are for second breast cancers. The dotted line in A1 and B1 indicates perfect agreement between predicted and observed mortality. The black dots and bars in A1 and B1 represent the observed mortality with 95% confidence interval against deciles of the predicted mortality. AUC = area under the curve.

