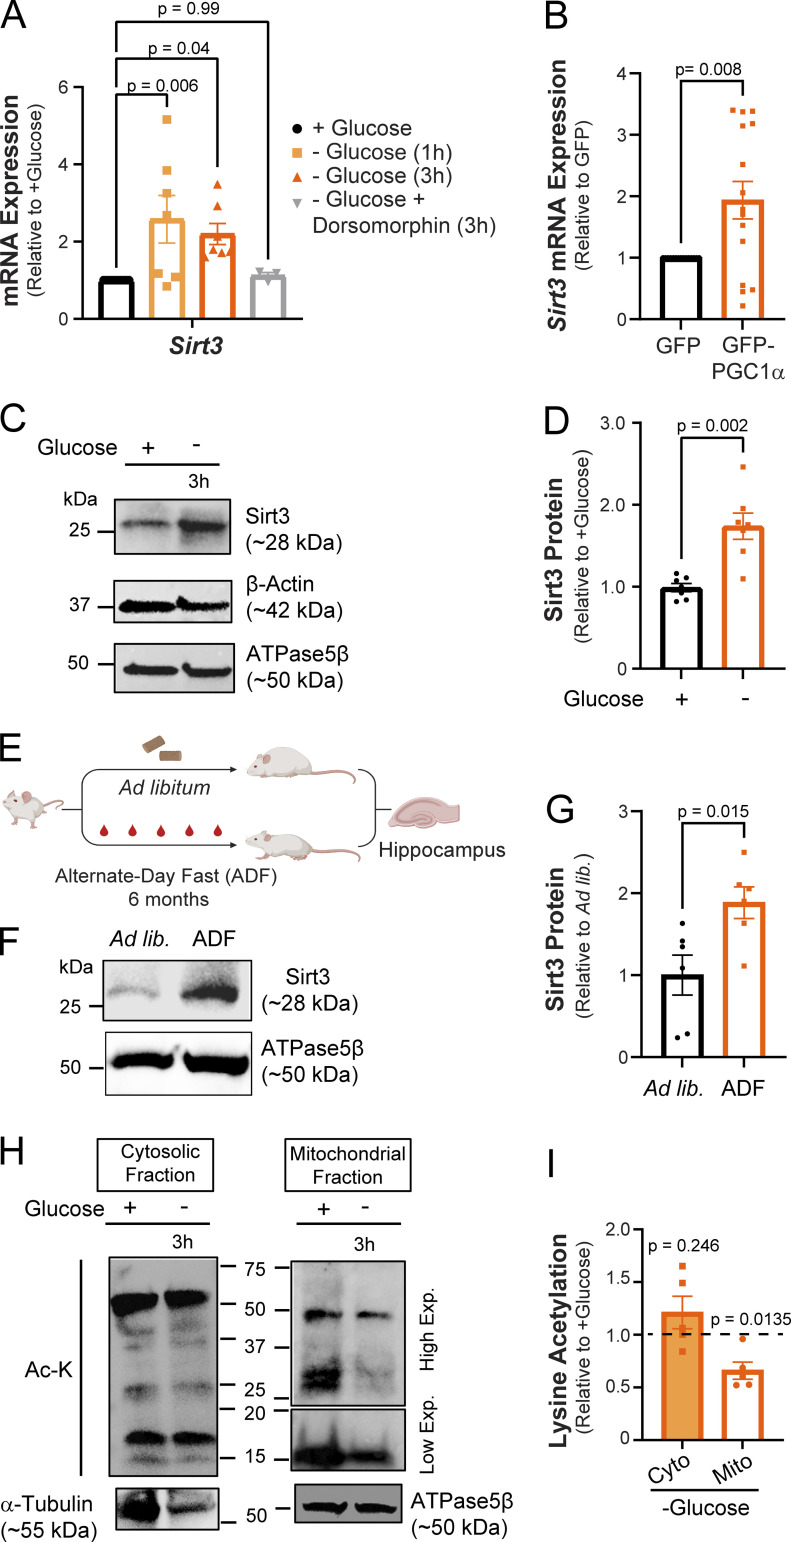
Figure 2.
Glucose deprivation stimulates neuronal Sirt3 expression and deacetylation of mitochondrial proteins. (A) Relative Sirt3 mRNA expression in control and glucose-deprived neurons. Values are normalized to β-actin mRNA and expressed relative to control (+glucose). n = 3–10 cortical samples. Average normalized mRNA level ± SEM: −glucose (1 h), 2.58 ± 0.62; −glucose (3 h), 2.20 ± 0.27; −glucose + dorsomorphin (3 h), 1.12 ± 0.08. n = 3–11 cortical samples. (B) Relative Sirt3 mRNA expression in cultures transduced with adenoviral particles encoding GFP (control) and GFP-PGC1α, normalized to 18s rRNA and expressed relative to control. Average normalized mRNA level ± SEM: GFP-PGC1α, 1.93 ± 0.30. n = 16 cortical samples/condition. (C) Immunoblotting of Sirt3 protein expression in cortical neurons with antibodies against Sirt3 and the cytosolic and mitochondrial controls, β-actin, and ATPase5β, respectively. (D) Sirt3 band intensity normalized to the ATPase5β and expressed relative to control. Average normalized Sirt3 band intensity ± SEM: +glucose, 0.99 ± 0.05; −glucose, 1.74 ± 0.16. n = 7 cortical samples/condition. (E) A paradigm for the analysis of Sirt3 expression in hippocampi of mice fed ad libitum (ad lib) or alternate-day fasted for 6 mo (ADF). Schematic created with https://biorender.com. (F) Immunoblotting of Sirt3 protein in mouse hippocampal lysates. (G) Sirt3 band intensity normalized to the ATPase5β band and expressed relative to the ad lib mice. Average normalized Sirt3 band intensity ± SEM: ad lib, 1 ± 0.24; ADF (6 mo), 1.88 ± 0.19. n = 6 mice/condition. (H) Mitochondrial and cytosolic fractions isolated from cortical neuronal cultures maintained for 3 h with (+) or without (−) glucose. High and low exposures were 60 and 25 s, respectively. (I) Intensity of lysine acetylation bands normalized to α-tubulin or ATPase5β plotted relative to control. Average normalized Ac-K intensity: cytosolic fraction (−glucose), 1.21 ± 0.15; mitochondrial fraction (−glucose), 0.66 ± 0.08. n = 5 cortical samples. One-way ANOVA (A), two-tailed, unpaired t test (B), Mann–Whitney U test (D and G), one sample t test (I). See Table 1. Source data are available for this figure: SourceData F2.

