Figure 4.
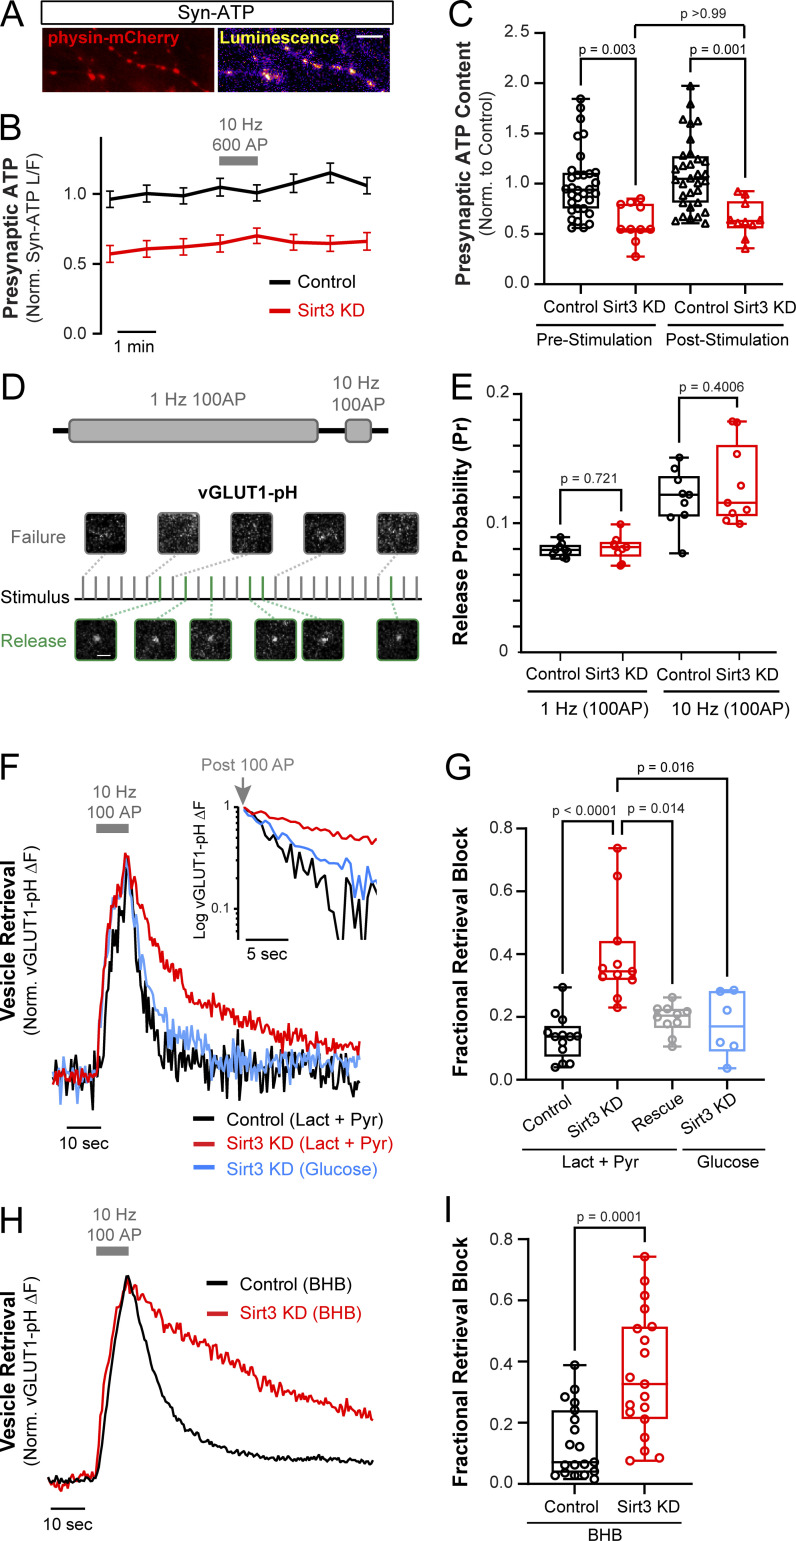
Sirt3 stimulates oxidative ATP production and sustains synaptic transmission in hippocampal nerve terminals. (A) Luminescence and fluorescence (physin-mCherry) images of hippocampal nerve terminals expressing Syn-ATP. (B) Normalized and pH-corrected presynaptic ATP traces in control and Sirt3 KD neurons were supplied with lactate and pyruvate and stimulated with 600 AP at 10 Hz. (C) Normalized ATP level before and after electrical stimulation. Average ATP level: control (prestimulation), 1.00 ± 0.06, Sirt3 KD (prestimulation), 0.61 ± 0.19, control (poststimulation), 1.10 ± 0.35, Sirt3 KD (poststimulation), 0.65 ± 0.18. n = 10–32 neurons. (D) Schematic for determination of SV release probability (Pr) using vGLUT1-pH in neurons stimulated with 100 AP at 1 Hz, or 10 Hz. Representative images from successful and failed release events are shown in green and grey, respectively. (E) Pr in control and Sirt3 KD terminals at different stimulation frequencies. Average Pr ± SEM: control (1 Hz), 0.079 ± 0.005, Sirt3 KD (1 Hz), 0.081 ± 0.003, control (10 Hz), 0.112 ± 0.007, Sirt3 KD (10 Hz), 0.116 ± 0.011. n = 9 coverslips. (F) Sample vGLUT1-pH traces of control, Sirt3 KD, and neurons expressing shRNA-resistant Sirt3 (rescue) stimulated with 100 AP at 10 Hz in the presence of glucose or lactate/pyruvate. Inset: Semi-log plot of vGLUT1-pH traces following stimulation. (G) Fractional retrieval block of vGLUT1-pH was calculated as described in Materials and methods. n = 6–13 neurons. Average retrieval block ± SEM: control (lact+pyr), 0.14 ± 0.02, Sirt3 KD (lact+pyr), 0.40 ± 0.05, rescue (lact+pyr), 0.19 ± 0.01, Sirt3 KD (glucose), 0.18 ± 0.04. n = 6–13 neurons. (H) Sample vGLUT1-pH traces of control and Sirt3 KD neurons stimulated with 100 AP at 10 Hz in the presence of β-hydroxybutyrate (BHB). (I) Fractional retrieval block of vGLUT1-pH. n = 19 neurons. Average retrieval block ± SEM: control, 0.13 ± 0.03, Sirt3 KD, 0.36 ± 0.05. Gray bars and arrows denote electrical stimulation. The box-whisker plots denote median (line), 25th–75th percentile (box), and min-max (whiskers). Kruskal–Wallis test (C and G), two-sample t test (E), Mann–Whitney U test (I). See Table 1.

