Figure S2.
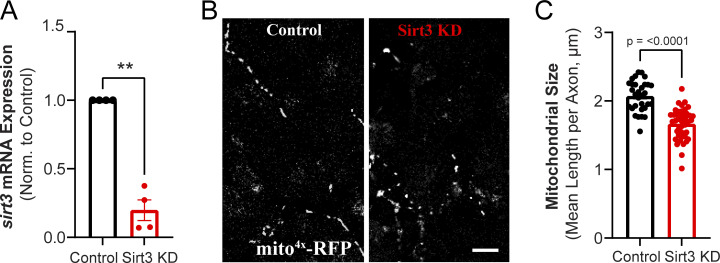
(Related to Fig. 3). Sirt3 regulates mitochondrial morphology in hippocampal axons. (A) Relative expression of sirt3 mRNA in control and Sir3 KD cortical neurons. Values are normalized to β-actin mRNA and expressed relative to the control. Average normalized mRNA level ± SEM: Sirt3 KD, 0.19 ± 0.07. n = 4 cortical samples. (B) Hippocampal axons from control and Sirt3 KD neurons expressing the mitochondrial marker mito4x-RFP. (C) Mitochondria length in control and Sirt3 KD axons. Mean length per neuronal axon (μm) ± SEM: control, 2.0 ± 0.03, Sirt3 KD, 1.6 ± 0.03. n = 31–42 neurons. Two-tailed, unpaired t test (A and C).

