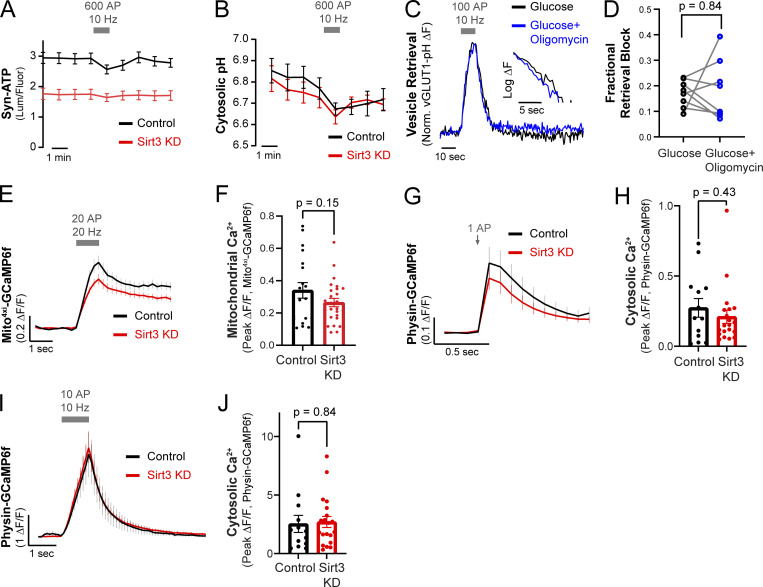
Figure S3.
(Related to Fig. 4). Quantification of presynaptic ATP, cytosolic pH, mitochondrial and cytosolic calcium dynamics in control and Sirt3 KD nerve terminals. (A) Average traces of raw luminescence/fluorescence values of control and Sirt3 KD hippocampal nerve terminals expressing Syn-ATP, electrically stimulated with 600 AP at 10 Hz. n = 10–32 neurons. (B) Average traces of cytosolic pH in control and Sirt3 KD terminals expressing cyto-pHluorin, electrically stimulated with 600 AP at 10 Hz. n = 7–8 neurons. (C) Representative vGLUT1-pH traces of a neuron supplied with 5 mM glucose, with or without incubation with 2 µM oligomycin. (D) Fractional retrieval block of vGLUT1-pH. Average retrieval block ± SEM: Glucose, 0.14 ± 0.02, Glucose + Oligomycin 0.40 ± 0.05. n = 8 neurons. (E) Average traces of mito4xi-GCaMP6f showing mitochondrial Ca2+ uptake in control and Sirt3 KD axons stimulated with 20 AP at 20 Hz. (F) Peak responses of Mito4xi - GCaMP6f (ΔF/F) following stimulation. Mean ΔF/F ± SEM: control, 0.34 ± 0.04, Sirt3 KD, 0.26 ± 0.02. n = 19–26 neurons. (G) Average traces of physin-GCaMP6f showing cytosolic Ca2+ uptake in control and Sirt3 KD axons stimulated with 1AP. (H) Peak responses of physin-GCaMP6f (ΔF/F) to stimulation. Mean ΔF/F ± SEM: control, 0.27 ± 0.06, Sirt3 KD, 0.21 ± 0.04. n = 13–20 neurons. (I) Average traces of physin-GCaMP6f showing cytosolic Ca2+ uptake in control and Sirt3 KD axons stimulated with 10 AP at 10 Hz. (J) Peak responses of physin-GCaMP6f (ΔF/F). Mean ΔF/F ± SEM: control, 2.5 ± 0.7, Sirt3 KD, 2.7 ± 0.4. n = 13–20 neurons. Grey bars or arrows denote electrical stimulation. Error bars are SEM. Wilcoxon test (D), Two-tailed, unpaired t test (F, H, and J).

