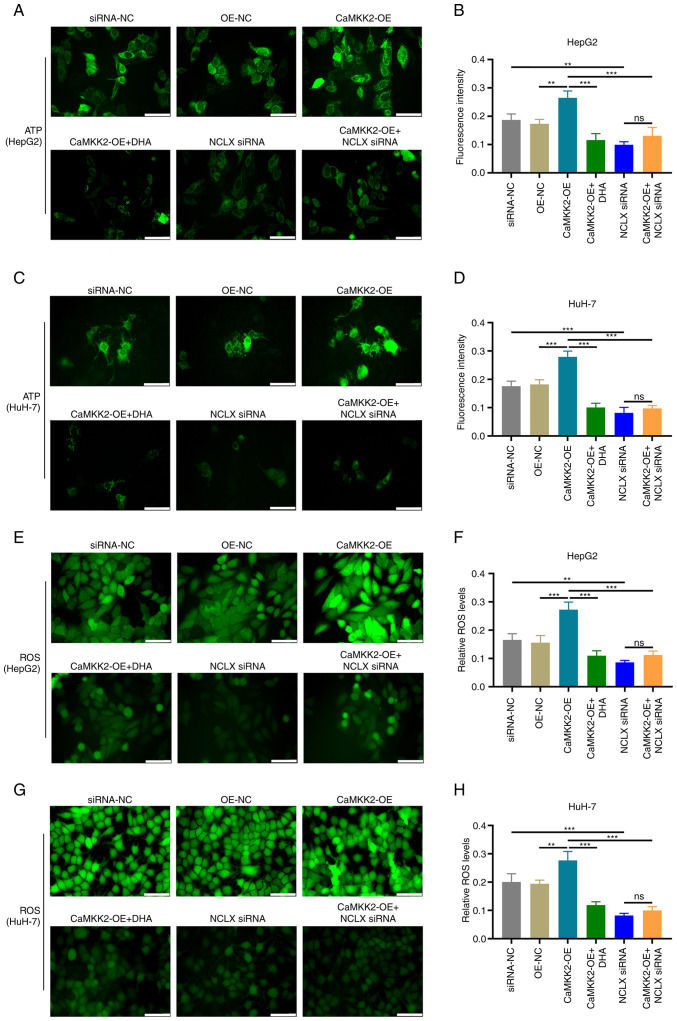
Figure 5.
Effects of DHA treatment, CaMKK2-OE and NCLX siRNA on the production of ATP and ROS in liver cancer cells. (A) ATP levels and (B) fluorescence intensity of HepG2 cells treated with DHA, CaMKK2-OE and/or NCLX siRNA. (C) ATP levels and (D) fluorescence intensity of HuH-7 cells treated with DHA, CaMKK2-OE and/or NCLX siRNA. (E) Intracellular ROS levels and (F) fluorescence intensity of HepG2 cells treated with DHA, CaMKK2-OE and/or NCLX siRNA. (G) Intracellular ROS levels and (H) fluorescence intensity of HuH-7 cells treated with DHA, CaMKK2-OE and/or NCLX siRNA. Scale bar, 20 µm. All data are presented as the mean ± standard deviation (n=3). Data were analyzed using one-way analysis of variance followed by Bonferroni post hoc test. **P<0.01; ***P<0.001. NCLX, mitochondrial sodium/calcium exchanger protein; DHA, dihydroartemisinin; CaMKK2, calcium/calmodulin-dependent protein kinase kinase 2; siRNA, small interfering RNA; OE, overexpression; ns, not significant; NC, negative control; ROS, reactive oxygen species.

