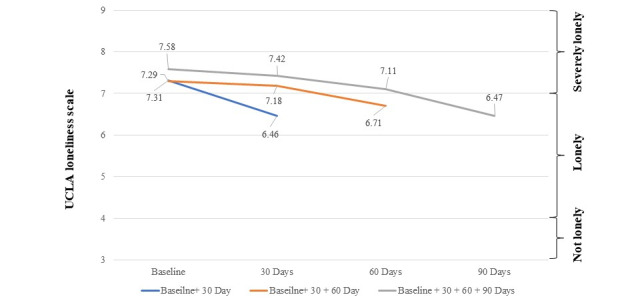
Figure 3.

Change in Loneliness: UCLA Loneliness scores between 3 and 4 indicate nonlonely participants. Scores between 4 and 7 indicate lonely individuals. Scores between 7 and 9 indicate severely lonely individuals. The average score for participants with complete data (gray line) and incomplete data (orange and blue lines) indicates that the groups were all severely lonely. The participants who only reported loneliness at baseline and at 30 days had the greatest improvement in loneliness (blue line). The change in loneliness over time did not differ for participants with complete data (gray line) versus incomplete data (orange and blue lines). UCLA-3: University of California, Los Angeles.
