
Figure 4.
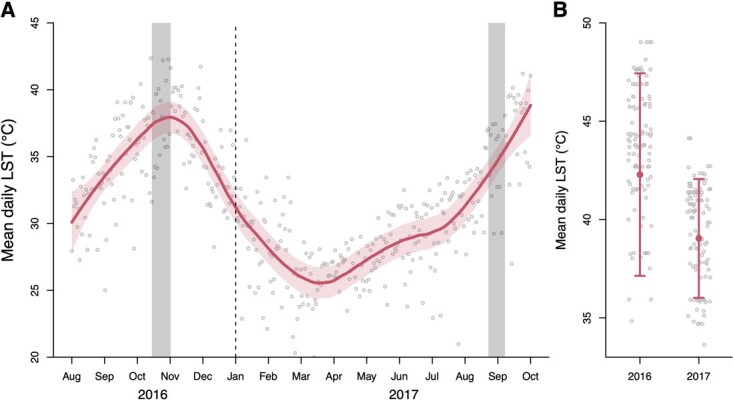
Mean daily LST change over time in Ruaha–Rungwa ecosystem during 2016–2017. LST varied greatly throughout the seasons (A) and between years (B). Sampled individuals experienced significantly higher LST in 2016 as compared to 2017 (B). In (A) daily LST values (gray circles) and the daily average LST (red line) for the entire study area, from August 2016 to October 2017 are shown, as well as the timing of the two study period (shaded gray area). Note that 95% confidence interval is the shaded red area or the arrows.