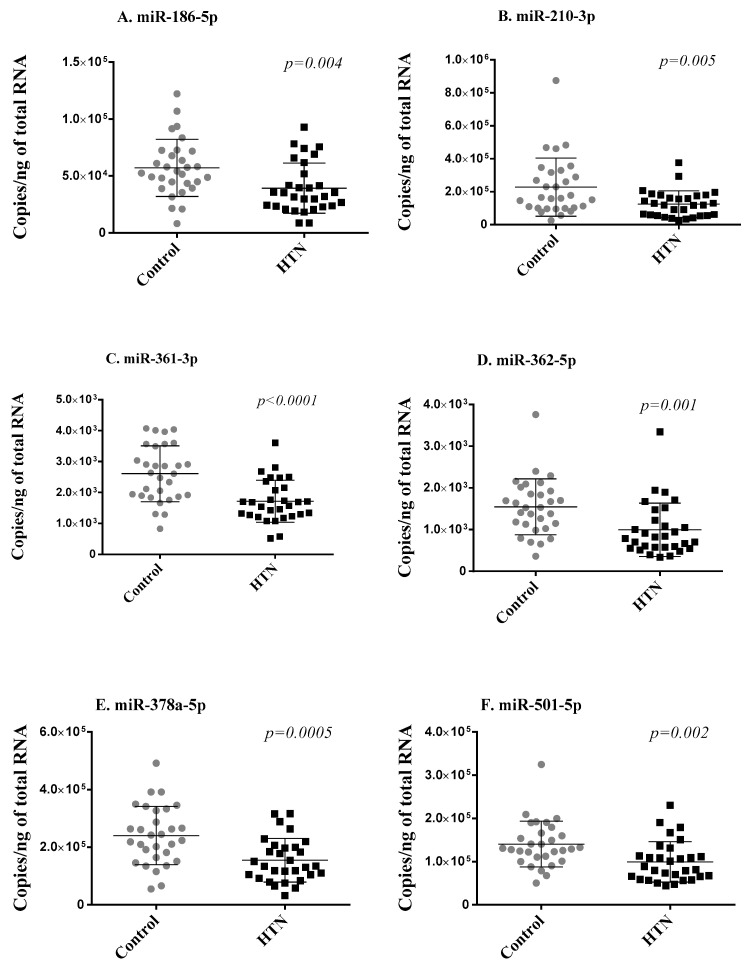
Figure 2.
Replication phase. Six miRNAs (A–F) differentially expressed in small RNA sequencing were assessed via RT-qPCR in whole blood samples of the 2 groups of 30 age- and sex-matched hypertension subjects and 30 control subjects forming the discovery cohort. Expression levels of miRNAs are expressed as the number of copies per ng of RNA and are shown as scatterplots indicating mean ± standard deviation. p-values from Mann–Whitney Rank Sum test are indicated.

