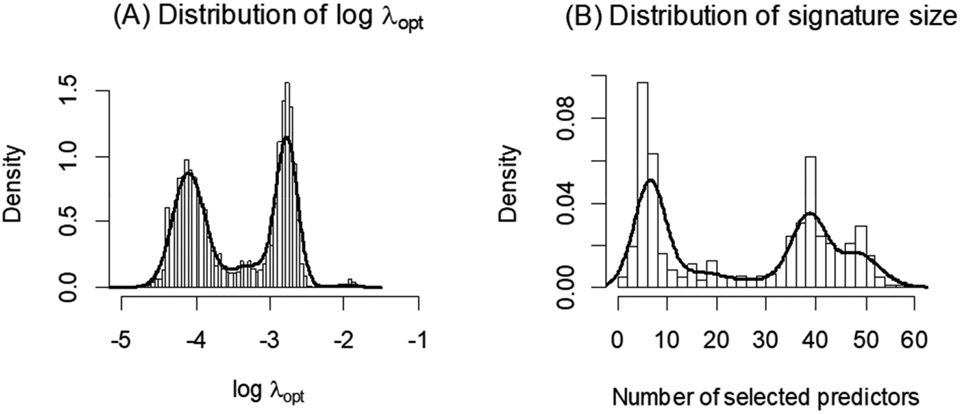
Figure 1.
Distribution of (A) across 1000 runs of glmnet is shown, along with the distribution of the corresponding number of predictors in the signatures (B). Each application of the glmnet algorithm for this dataset results in an optimal signature, with size varying greatly from less than 5 to over 50 predictors.

