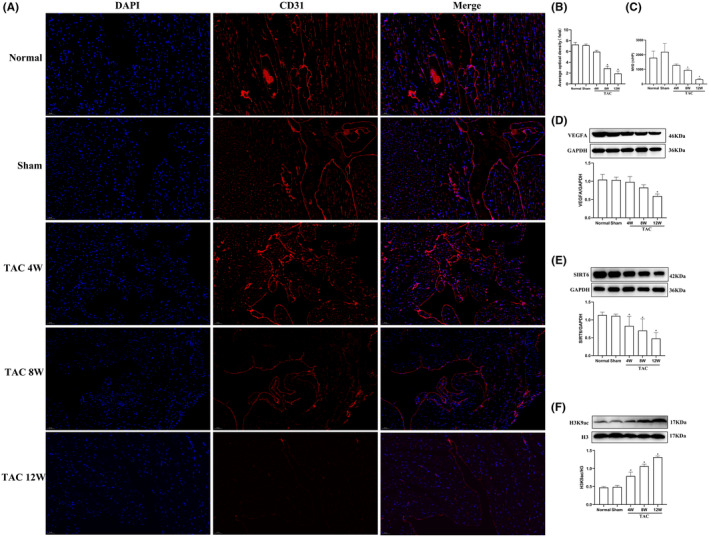
FIGURE 2.

Levels of SIRT6, VEGFA, and H3K9ac and angiogenesis in myocardial tissues of TAC mice. (A) CD31 expression in myocardial cells was detected by immunofluorescence. Red fluorescence indicates CD31, and blue fluorescence indicate nuclei (DAPI stain). Scale bar = 50 μm. (B) Average optical density in each group. (C) Quantitative statistics of the MVD (n = 3). (D–F) Protein expression levels of VEGFA, SIRT6 and H3K9ac were examined by western blotting (n = 6). H3K9ac, acetylated lysine 9 on histone H3; TAC, thoracic aortic constriction; W, weeks. *p < 0.05 vs. the Sham group.
