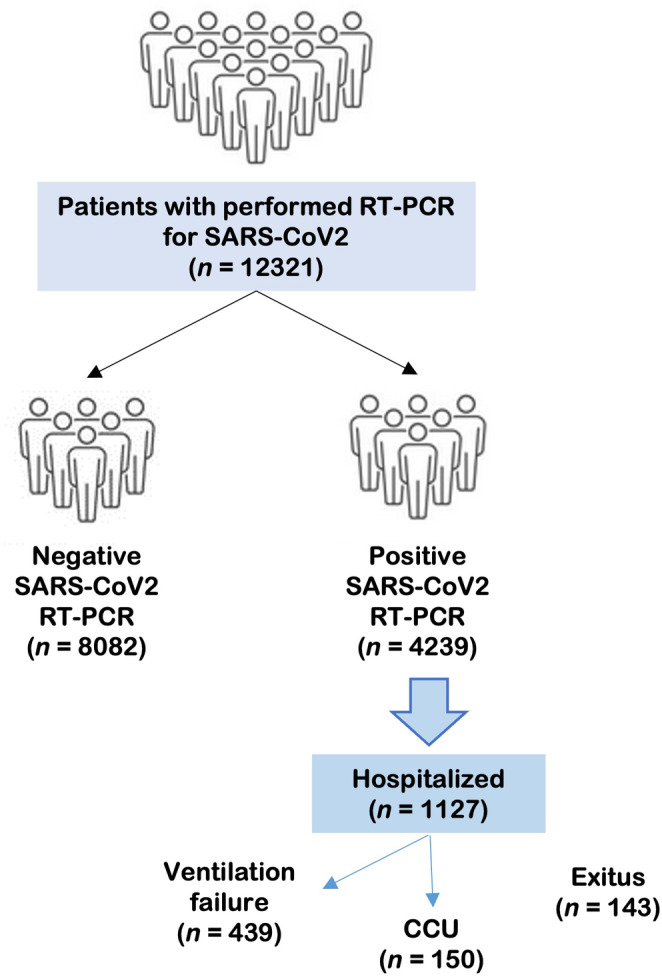
FIGURE 1.

Flow chart shows the distribution of the patients included in the study, a total of 12,321. Patients with infectious or respiratory symptons are divided in a negative or positive group according to PCR result. In the subgroup of hospitalized patients, patients are classified based on clinical severity: ventilatory failure, admitted to critical care unit (CCU) or exitus.
