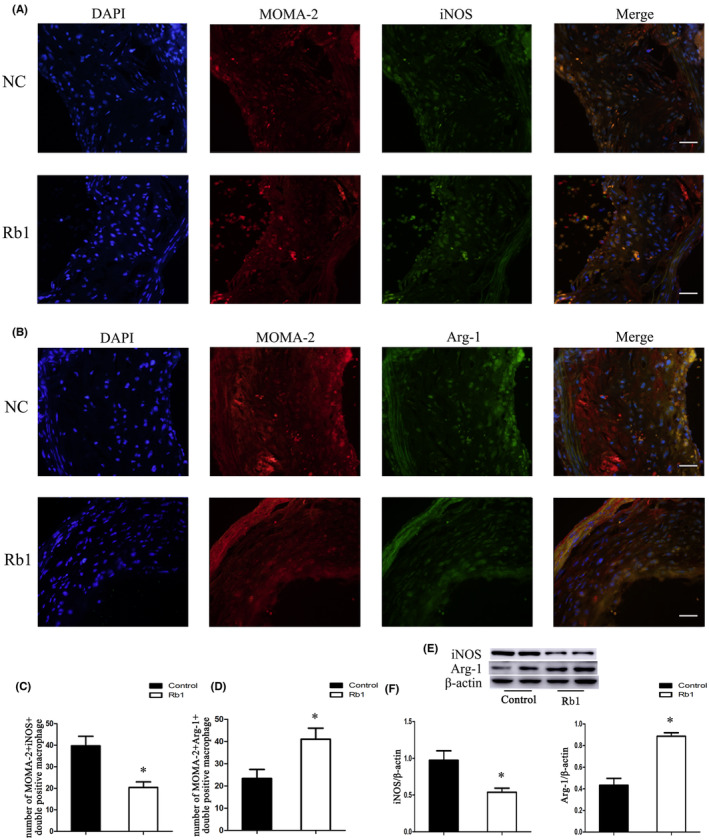
FIGURE 5.

Effects of Rb1 on macrophage polarisation in atherosclerotic lesions of ApoE−/−mice. (A, B) Representative images of MOMA‐2+iNOS+ and MOMA‐2+Arg‐1+ macrophages in situ in control group (NC) and Rb1 treatment group (Rb1). (C, D) Statistics of the number of MOMA‐2+iNOS+ and MOMA‐2+Arg‐1+ macrophages in atherosclerotic lesions in control group (NC) and Rb1 treatment group (Rb1). Scale bar: 20 μm. *p < 0.05; n = 6. (E) Representative immunoblots of iNOS (M1 marker) and Arg‐1 (M2 marker) in vivo. (F) Statistics of iNOS and Arg‐1 expression relative to the β‐actin level. Data were presented as means ± S.D.; *p < 0.05, compared to control group; n = 3.
