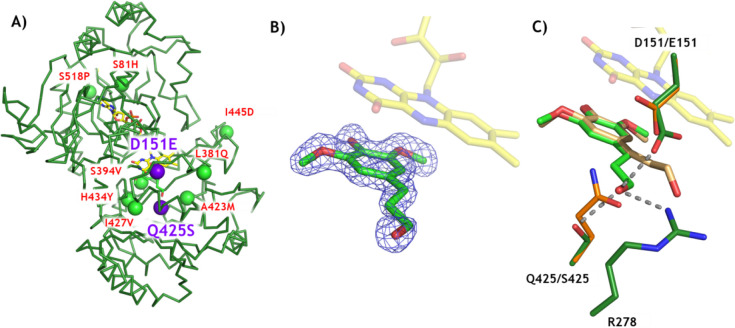
Figure 5.
X-ray structure of EUGO10X. (A) Backbone of EUGO10X with its mutation sites shown as spheres. The two additional chemoselectivity-affording mutations are represented with purple spheres (D151E and Q425S). (B) 2Fo-Fc electron density map of dihydrosinapyl alcohol in the active site. The map is contoured at a 1.0 σ level. (C) Comparison between EUGO8X (orange) and EUGO10X (green). The bound ligands are shown in wheat (EUGO8X) and green (EUGO10X).

