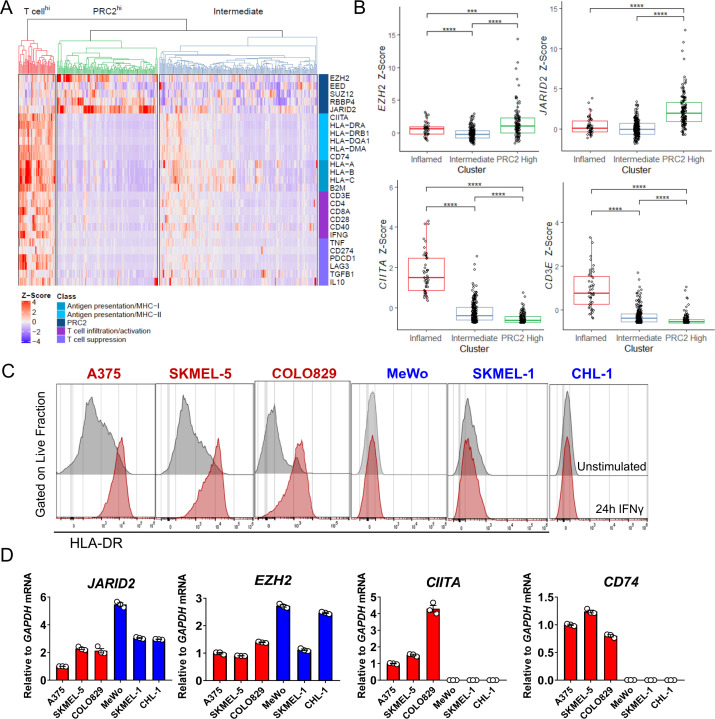
Figure 1.
High expression of PRC2 genes correlates with low expression of tumor-specific MHC class II genes. (A) Cluster analysis was performed using z-scores calculated from RNA sequencing expression data of patient with melanoma tumors gathered from The Cancer Genome Atlas. (B) mRNA expression of PRC2 genes (EZH2 and JARID2) and T-cell genes (CD3E, CD4, CD8A) across T cellhi/(red boxes), Intermediate (blue boxes), and PRC2hi (green boxes) patient clusters. Box plots show the median, first and third quartiles. The whiskers extend to the maxima and minima but no further than 1.5 times the IQR. Data were analyzed by analysis of variance followed by a Tukey’s post hoc test. ***p<0.001; ****p<0.0001. (C) Flow cytometry histograms representing live fractions of interferon-γ-stimulated (red histograms) human melanoma cell lines compared with unstimulated controls (gray histograms). Following staining with a live-dead dye, cells were labeled with fluorophore-conjugated HLA-DR antibodies. (D) qPCR analysis of human melanoma cell lines characterized for mRNA expression of the indicated genes of interest relative to GAPDH mRNA expression values for each cell line. Values were calculated as fold expression relative to A375 cells.CIITA, class II major histocompatibility complex transactivator II; EZH2, enhancer of zeste 2 polycomb repressive complex 2 subunit; HLA-DR, human leukocyte antigen-DR ; JARID2, Jumoni and AT-rich interaction domain-containing protein; MHC, major histocompatibility complexes; mRNA, messenger RNA; PRC2, polycomb repressive complex 2; qPCR, quantitative polymerase chain reaction.

