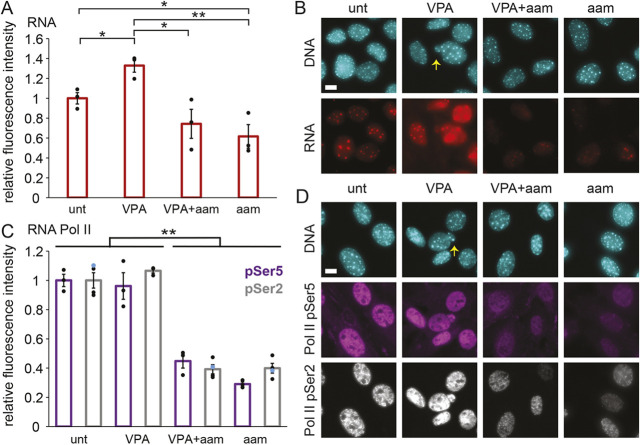
Fig. 1.
Transcription is decreased upon treatment with the RNA pol II inhibitor α-amanitin in both untreated and VPA-treated MEFs. (A,B) Graph (A) and example images (B) of RNA fluorescence levels in MEFs, labeled via EU Click-iT chemistry (red) and DNA labeled via Hoechst (cyan) for untreated (‘unt’), VPA-treated, VPA- and α-amanitin-treated (‘VPA+aam’), and α-amanitin-treated (‘aam’) cells. (C,D) Graph (C) and example images (D) of immunofluorescence levels of RNA pol II phosphorylated at Ser5 (purple, initiating) and Ser2 (gray, elongating) with DNA labeled via Hoechst (cyan). Yellow arrows denote nuclear blebs in example images. α-Amanitin treatment was for 24 h. Three biological replicates were performed with n>30 cells. Error bars represent standard error. *P<0.05; **P<0.01 (two-tailed unpaired Student's t-test). Scale bars: 10 µm.

