Fig. 2.

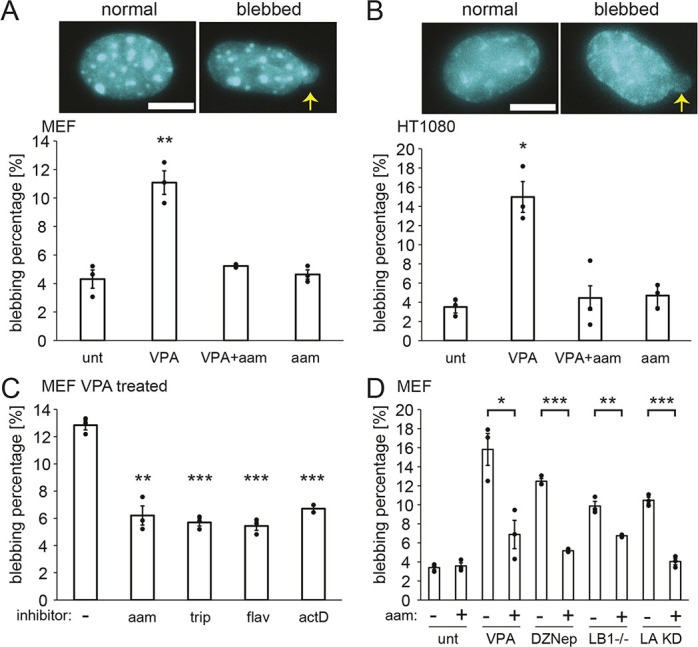
Transcription inhibition suppresses nuclear blebbing across cell types, drugs and perturbations that cause nuclear blebbing. (A,B) Example images and graph of percentages of nuclei that bleb in MEF cells (A) and HT1080 cells (B) for untreated (‘unt’), VPA-treated (VPA), VPA- and α-amanitin-treated (‘VPA+aam’), and α-amanitin-treated (‘aam’) cells. The means of three biological replicates with n=60–200 cells each are shown as dots. Yellow arrows denote nuclear blebs in example images. Scale bars: 10 µm. (C) Graph of percentages of nuclei that blebbed in VPA-treated MEF cells with or without the RNA pol II inhibitors α-amanitin (‘aam’, 24 h), triptolide (‘trip’, 24 h), flavopiridol (‘flav’, 24 h) and actinomycin D (‘actD’, 1.5 h). The means of three technical replicates with n>100 cells each are shown as dots. (D) Graph of percentages of nuclei that blebbed in wild-type cells (‘unt’) and different perturbations without or with the RNA pol II inhibitor α-amanitin (‘aam’). The perturbations were: increased euchromatin (VPA treatment), decreased heterochromatin (DZNep treatment), lamin B1 knockout (LB1−/− cells) and lamin A knockdown (LA KD cells). The means of three biological replicates are shown as dots with n>71 cells each for ‘unt’ and ‘VPA’, and with n>300 cells each for ‘DZNep’, ‘LB1−/−’ and ‘LA KD’. Error bars represent standard error. *P<0.05; **P<0.01; ***P<0.001 (two-tailed unpaired Student's t-test).
