Fig. 5.

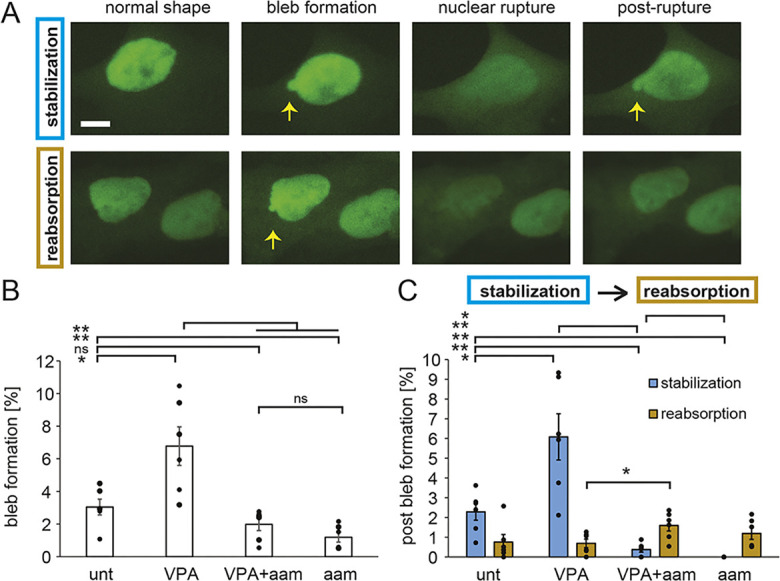
Bleb formation and stabilization are dependent on transcription activity. (A) Example images of stabilization (top, blue) or reabsorption (bottom, gold) of a newly formed bleb tracked via NLS–GFP live-cell imaging. Yellow arrows denote blebs. Scale bar: 10 µm. (B) Graph of the percentages of nuclei that display new nuclear bleb formation in a 3-h timelapse for untreated (‘unt’), VPA-treated, VPA- and α-amanitin-treated (‘VPA+aam’), and α-amanitin-treated (‘aam’) cells. (C) Graph showing the percentages of nuclei that displayed new nuclear bleb formation alongside a nuclear rupture that resulted in either bleb stabilization (blue) or reabsorption (gold) post rupture. The averages were calculated from six biological replicates, graphed as dots, and each consisted of n=100–300 cells. α-Amanitin treatment was for 24 h. Error bars represent standard error. ns, not significant, P>0.05; *P<0.05; **P<0.01 (two-tailed unpaired Student's t-test).
