Fig. 6.
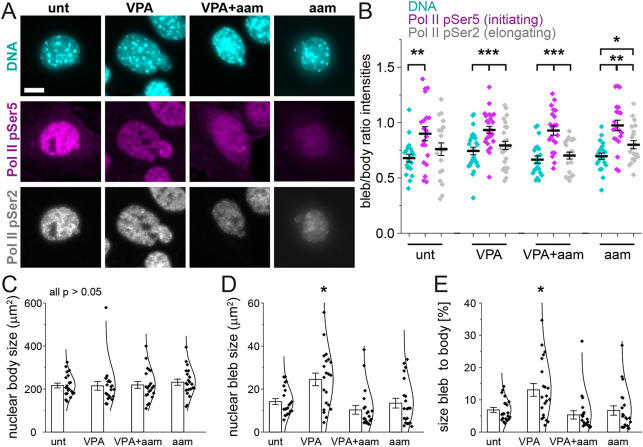
Transcription initiation is enriched in blebs relative to DNA content and overall supports bleb size. (A) Example images of Hoechst (DNA, cyan), RNA pol II phosphorylated at Ser5 (initiating, pSer5, magenta) and RNA pol II phosphorylated at Ser2 (elongating, pSer2, gray) staining in untreated (‘unt’), VPA-treated, VPA- and α-amanitin-treated (‘VPA+aam’), and α-amanitin-treated (‘aam’) cells. Scale bar: 10 µm. (B) Graph of the single-nucleus bleb intensity/nuclear body intensity ratio. DNA (Hoechst) signal intensity was decreased in blebs, but pol II pSer5 signal intensity in the bleb was enriched relative to DNA signal intensity and had a signal that was similar to that in the main nuclear body. (C–E) Graphs of average nuclear body size (C), nuclear bleb size (D) and average size of the bleb as a percentage of the nuclear body (E) (‘unt’, n=20; ‘VPA’, n=26; ‘VPA+aam’, n=21; ‘aam’, n=21). α-Amanitin treatment was for 24 h. Error bars represent standard error. *P<0.05; **P<0.01; ***P<0.001 (two-tailed unpaired Student's t-test).

