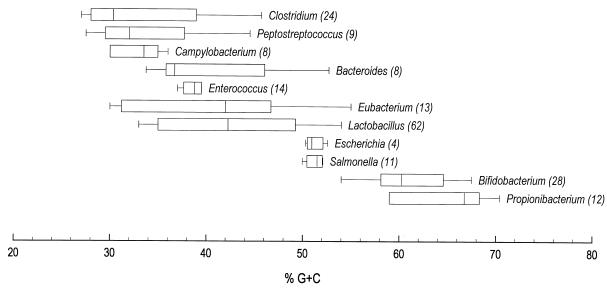
FIG. 3.
Ranges of percent G+C content in bacterial genera present in the GI tract of the chicken. Boxes indicate ranges, which accommodate 80% of the species within a given genus, and the vertical line in each box is the median of that genus. The values in parentheses show the number of species included in the survey. The figure is based on the literature data (13, 19, 22, 34, 37).

