Figure 5.
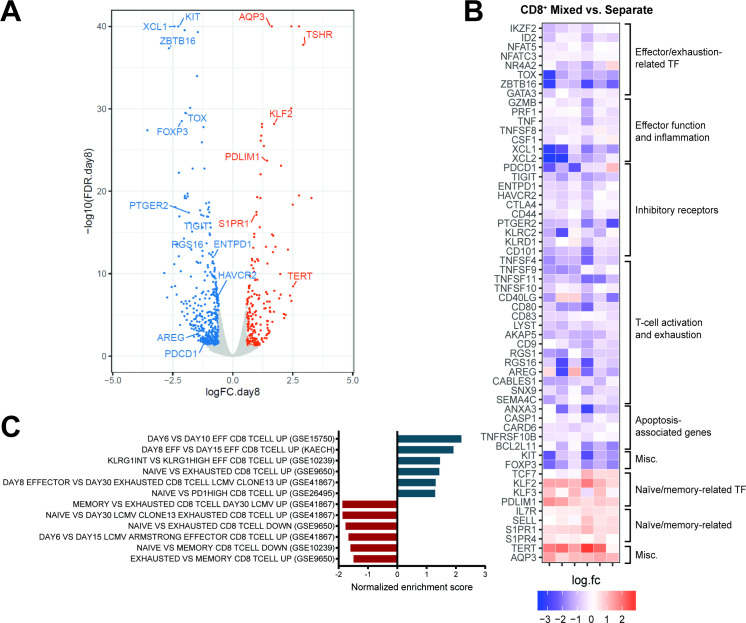
CD8+ CAR T cells cultured in presence or absence of CD4+ T cells exhibit distinct transcriptional signatures. Gene expression profiles of flow-sorted CD8+ tCD19+ 1.5.3-NQ-28-BB-z CAR T cells cultured either with CD4+ cells (“mixed”) or alone (“separate”) were evaluated by bulk RNA-seq on day 8 (n=6: 2 patients and 4 healthy donors). (A) Volcano plot of false discovery rate (FDR) (–log10) versus fold change (log2) showing differentially expressed genes between mixed versus separate CD8+ CAR T cells (FDR<0.05 and |log2FC|≥0.585 [≥1.5 fold change]), with upregulated and downregulated genes shown in orange and blue, respectively. (B) Heat map of fold change (log2) of selected genes (all with FDR<0.05) between mixed versus separate CD8+ CAR T cells in the 6 individual subjects. (C) Normalized enrichment scores from GSEA using selected gene sets related to CD8 naïve, memory, effector, and exhausted cells from the MSigDB C7 database, using the rankings of differential expression p values for all the genes. Positive/negative scores indicate enrichment of the gene sets in upregulated or downregulated genes when comparing mixed versus separate CD8+ CAR T cells. The FDR was ≤0.06 for all the gene sets shown here. GEO datasets are indicated in parentheses. CAR, chimeric antigen receptor; GSEA, gene set enrichment analysis;

