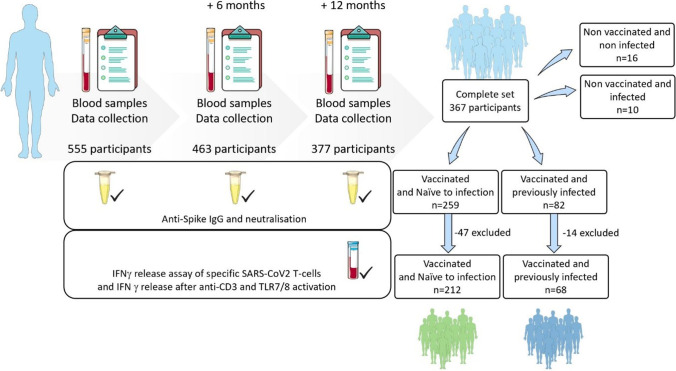
Fig. 1.
Flowchart of the Covimmune 2 study. Blood samples and data were collected at three time points (month 0, month 6 and month 12) starting in July 2020. At month 0 (n = 555) and month 6 (n = 463), only B cell response was assessed. For month 12, both B cell and T cell responses were measured. At the end of month 12 (December 2021), 367 participants had a complete set of data for the three time points. According to history of vaccination and SARS-CoV-2 infection, participants were classified as vaccinated and naive to infection (n = 212, 47 excluded), vaccinated and previously infected (n = 68, 14 excluded), non-vaccinated and non-infected (n = 16) and non-vaccinated and infected (n = 10)

