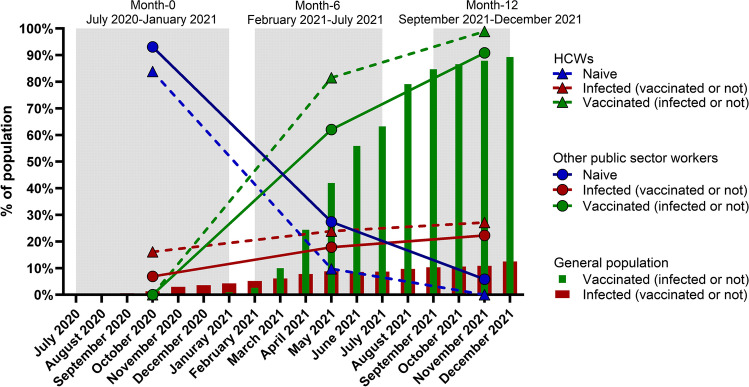
Fig. 2.
The evolution of vaccination and infection rates in the study cohort (n = 367) from July 2020 to December 2021. Relative infection and vaccination rates for each time point (month 0, month 6, month 12, shaded in grey) are shown for each group of participants: HCWs (n = 93) and workers in other areas of the public sector (n = 274), and compared to the monthly infection and vaccination rates of the general French population. HCWs, health care workers

