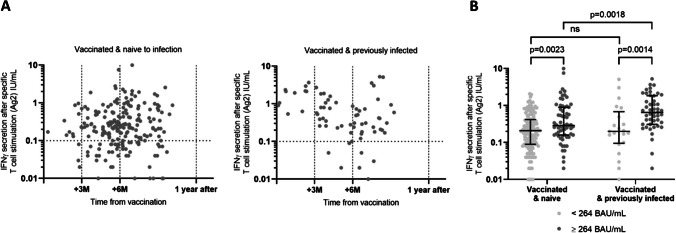
Fig. 4.
SARS-CoV-2 T cell response evolution in vaccinated individuals naive to infection or previously infected. A At month 12 of the study, plasma IFNγ was measured after SARS-CoV-2 specific T cell activation. Samples were placed in a timeline according to their distance in days from the second dose of vaccination. In vaccinated and naive to infection individuals, T cell response was stable over time (p = 0.3, Spearman r = 0.07). In the vaccinated and previously infected group, a slight decline of the cellular response was observed (p = 0.004, Spearman r = − 0.3). B Taking in consideration anti-SP IgG levels above or below the threshold of 264 BAU/mL, plasma IFNγ levels were compared between groups. In both groups, plasma IFNγ levels were higher in individuals displaying anti-SP IgG levels above the threshold. In individuals with anti-SP IgG levels above the threshold, median IFNγ levels were significantly higher in vaccinated and previously infected individuals (0.65 IU/mL vs 0.29 IU/mL). *p < 0.05, **p < 0.005, ***p < 0.0005, ****p < 0.00005

