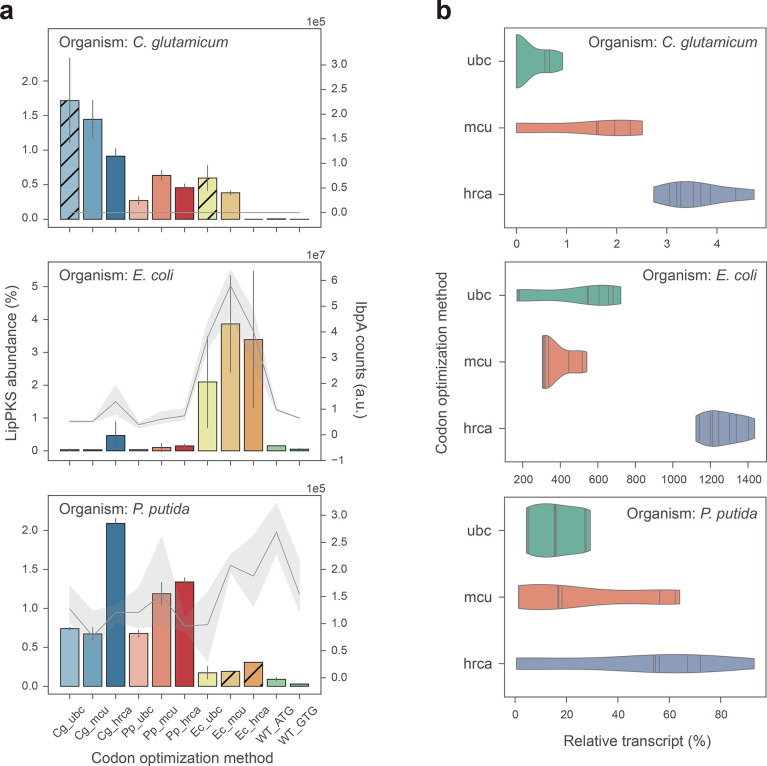
Figure 4.
Relative abundance of LipPKS peptides and transcript in heterologous hosts expressing different codon variants of LipPKS. (a) Calculated protein abundance (n = 3) is the relative intensity of the top 3 peptides that correspond to the target protein divided by the intensity of all proteins detected. Hatched bars indicate strains with nonexcisable backbones. Levels of the insolubility marker IbpA are represented by a gray line (n = 3). IbpA is not present in C. glutamicum. (b) Each violin represents the distribution of the relative transcript amount for all target host optimizations with the same optimization strategy (n = 9). Relative transcript was calculated from the Ct value difference between the target transcript and housekeeping gene. The lines within the violins are individual data points. Target host optimization: Cg = C. glutamicum; Ec = E. coli; Pp = P. putida; Optimization strategy: ubc = use best codon; mcu = match codon usage; hrca = harmonize relative codon adaptiveness.

