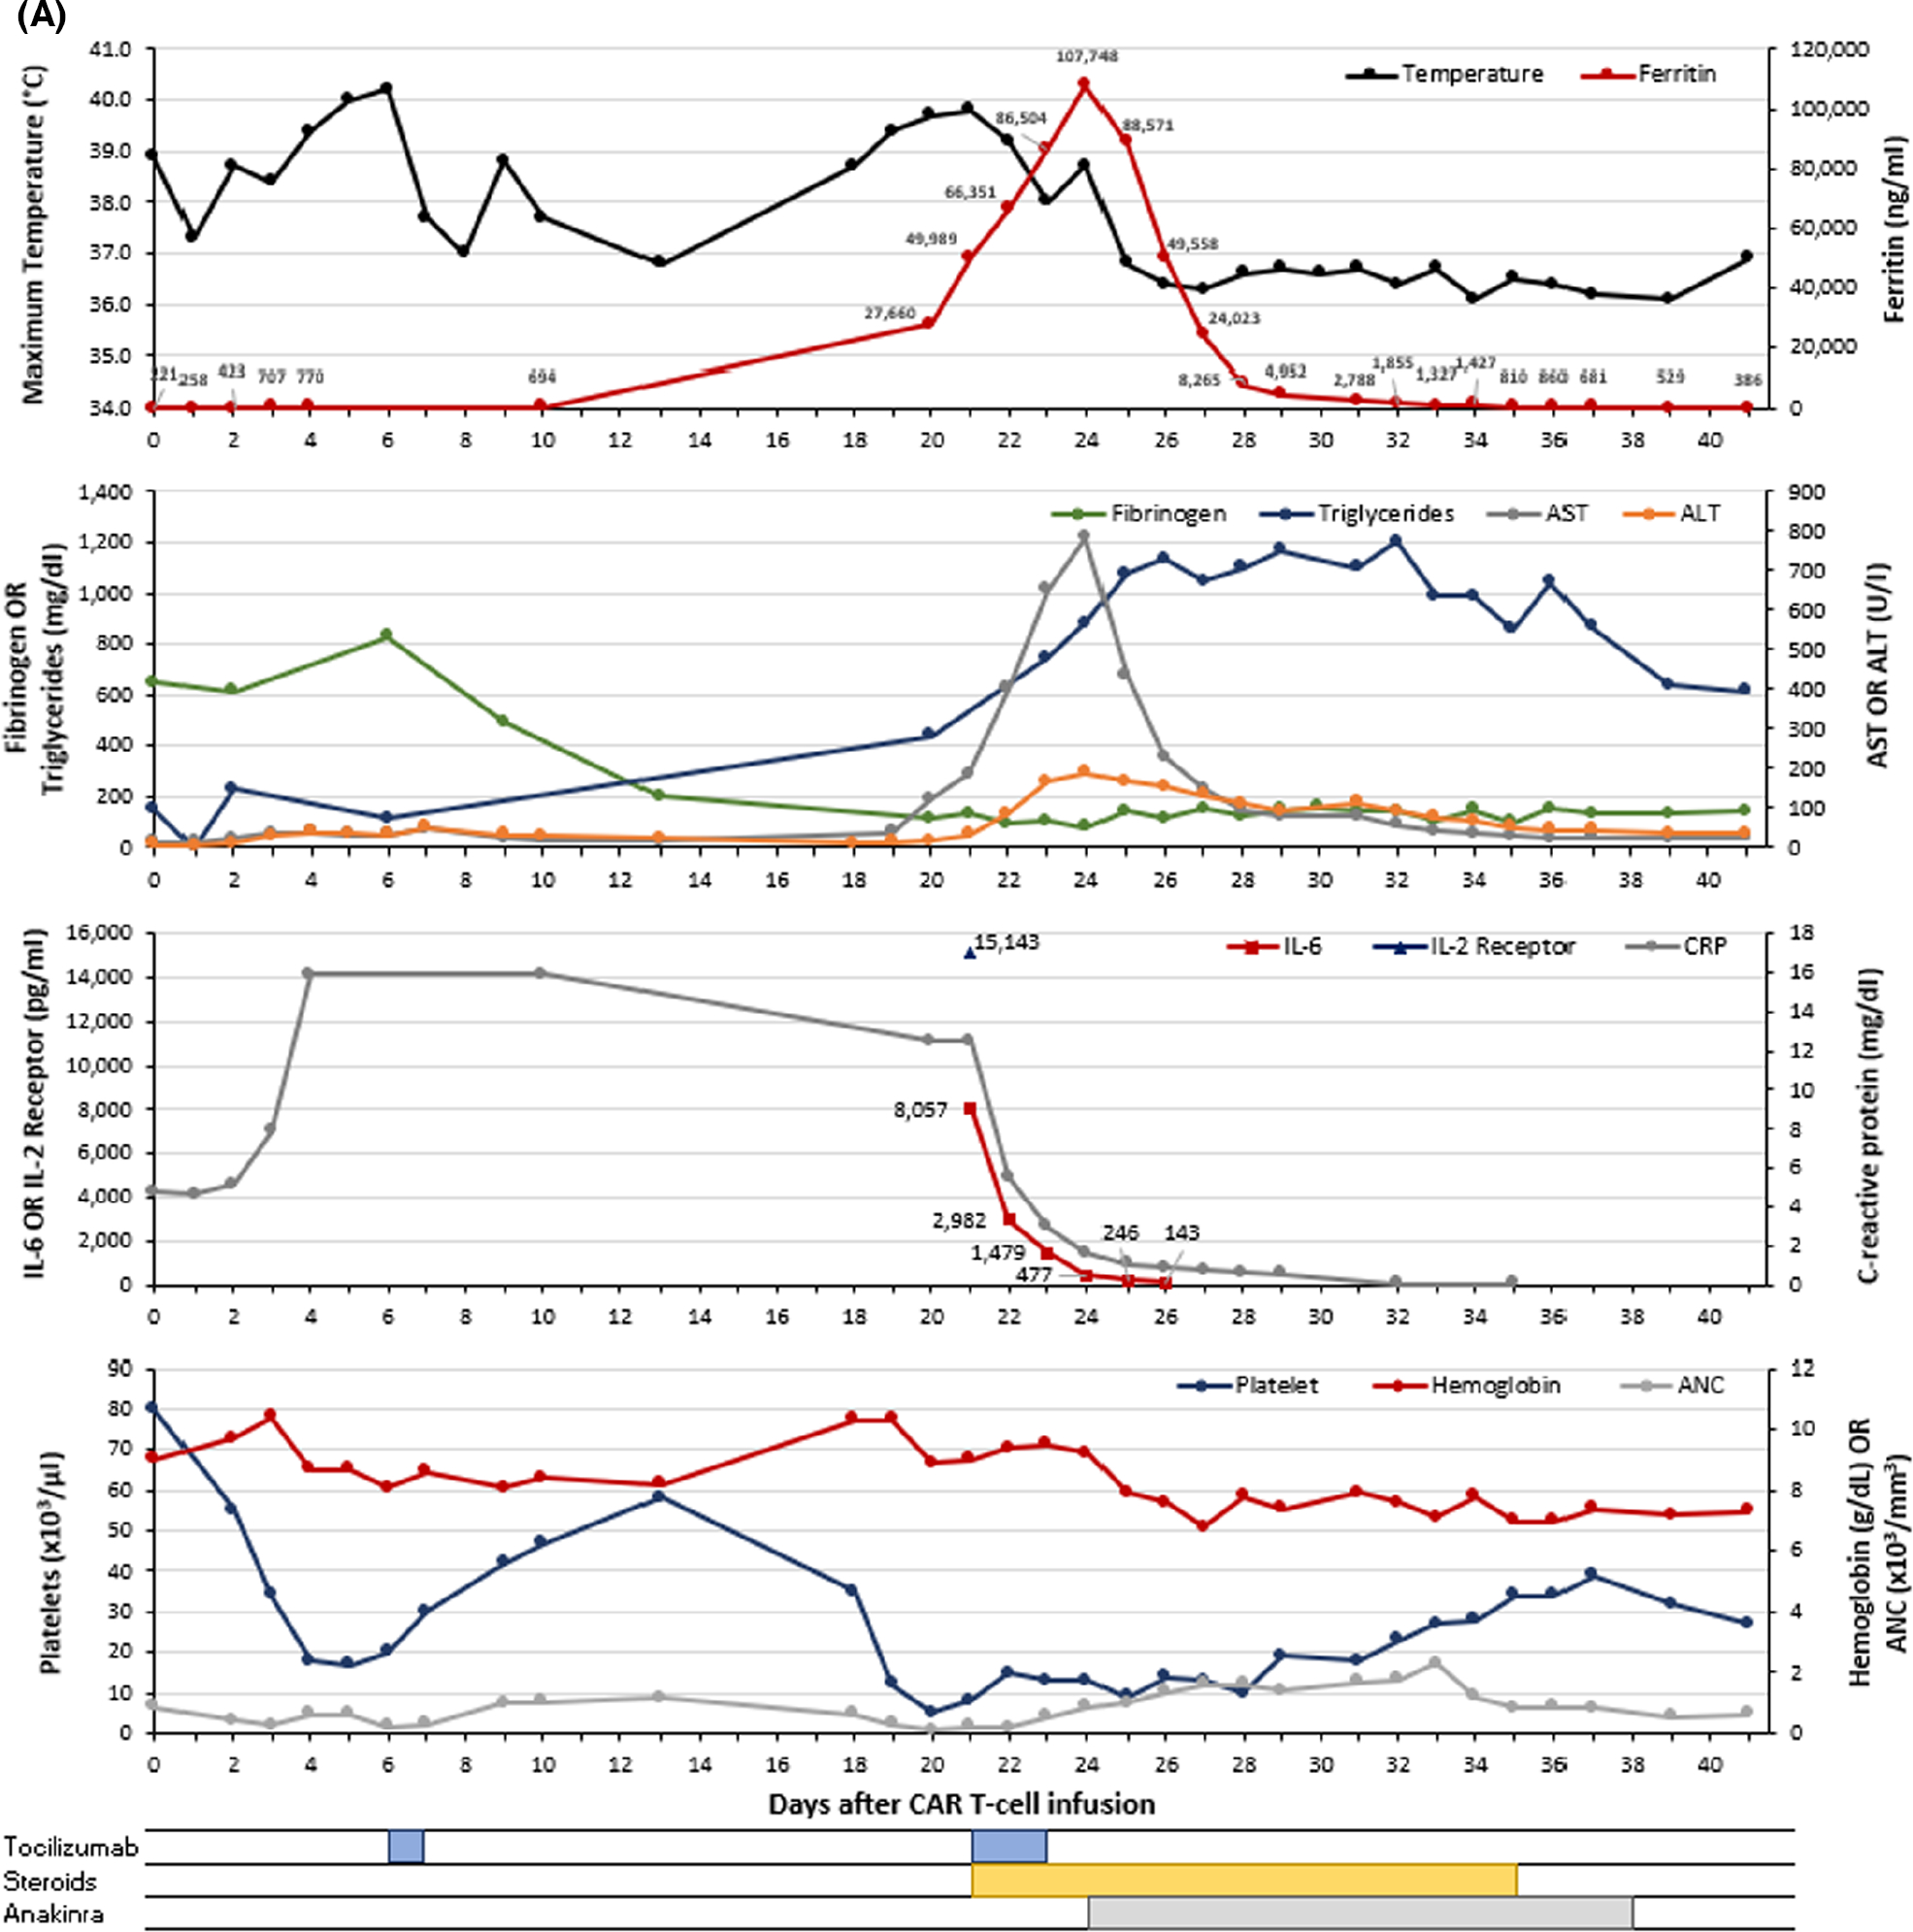
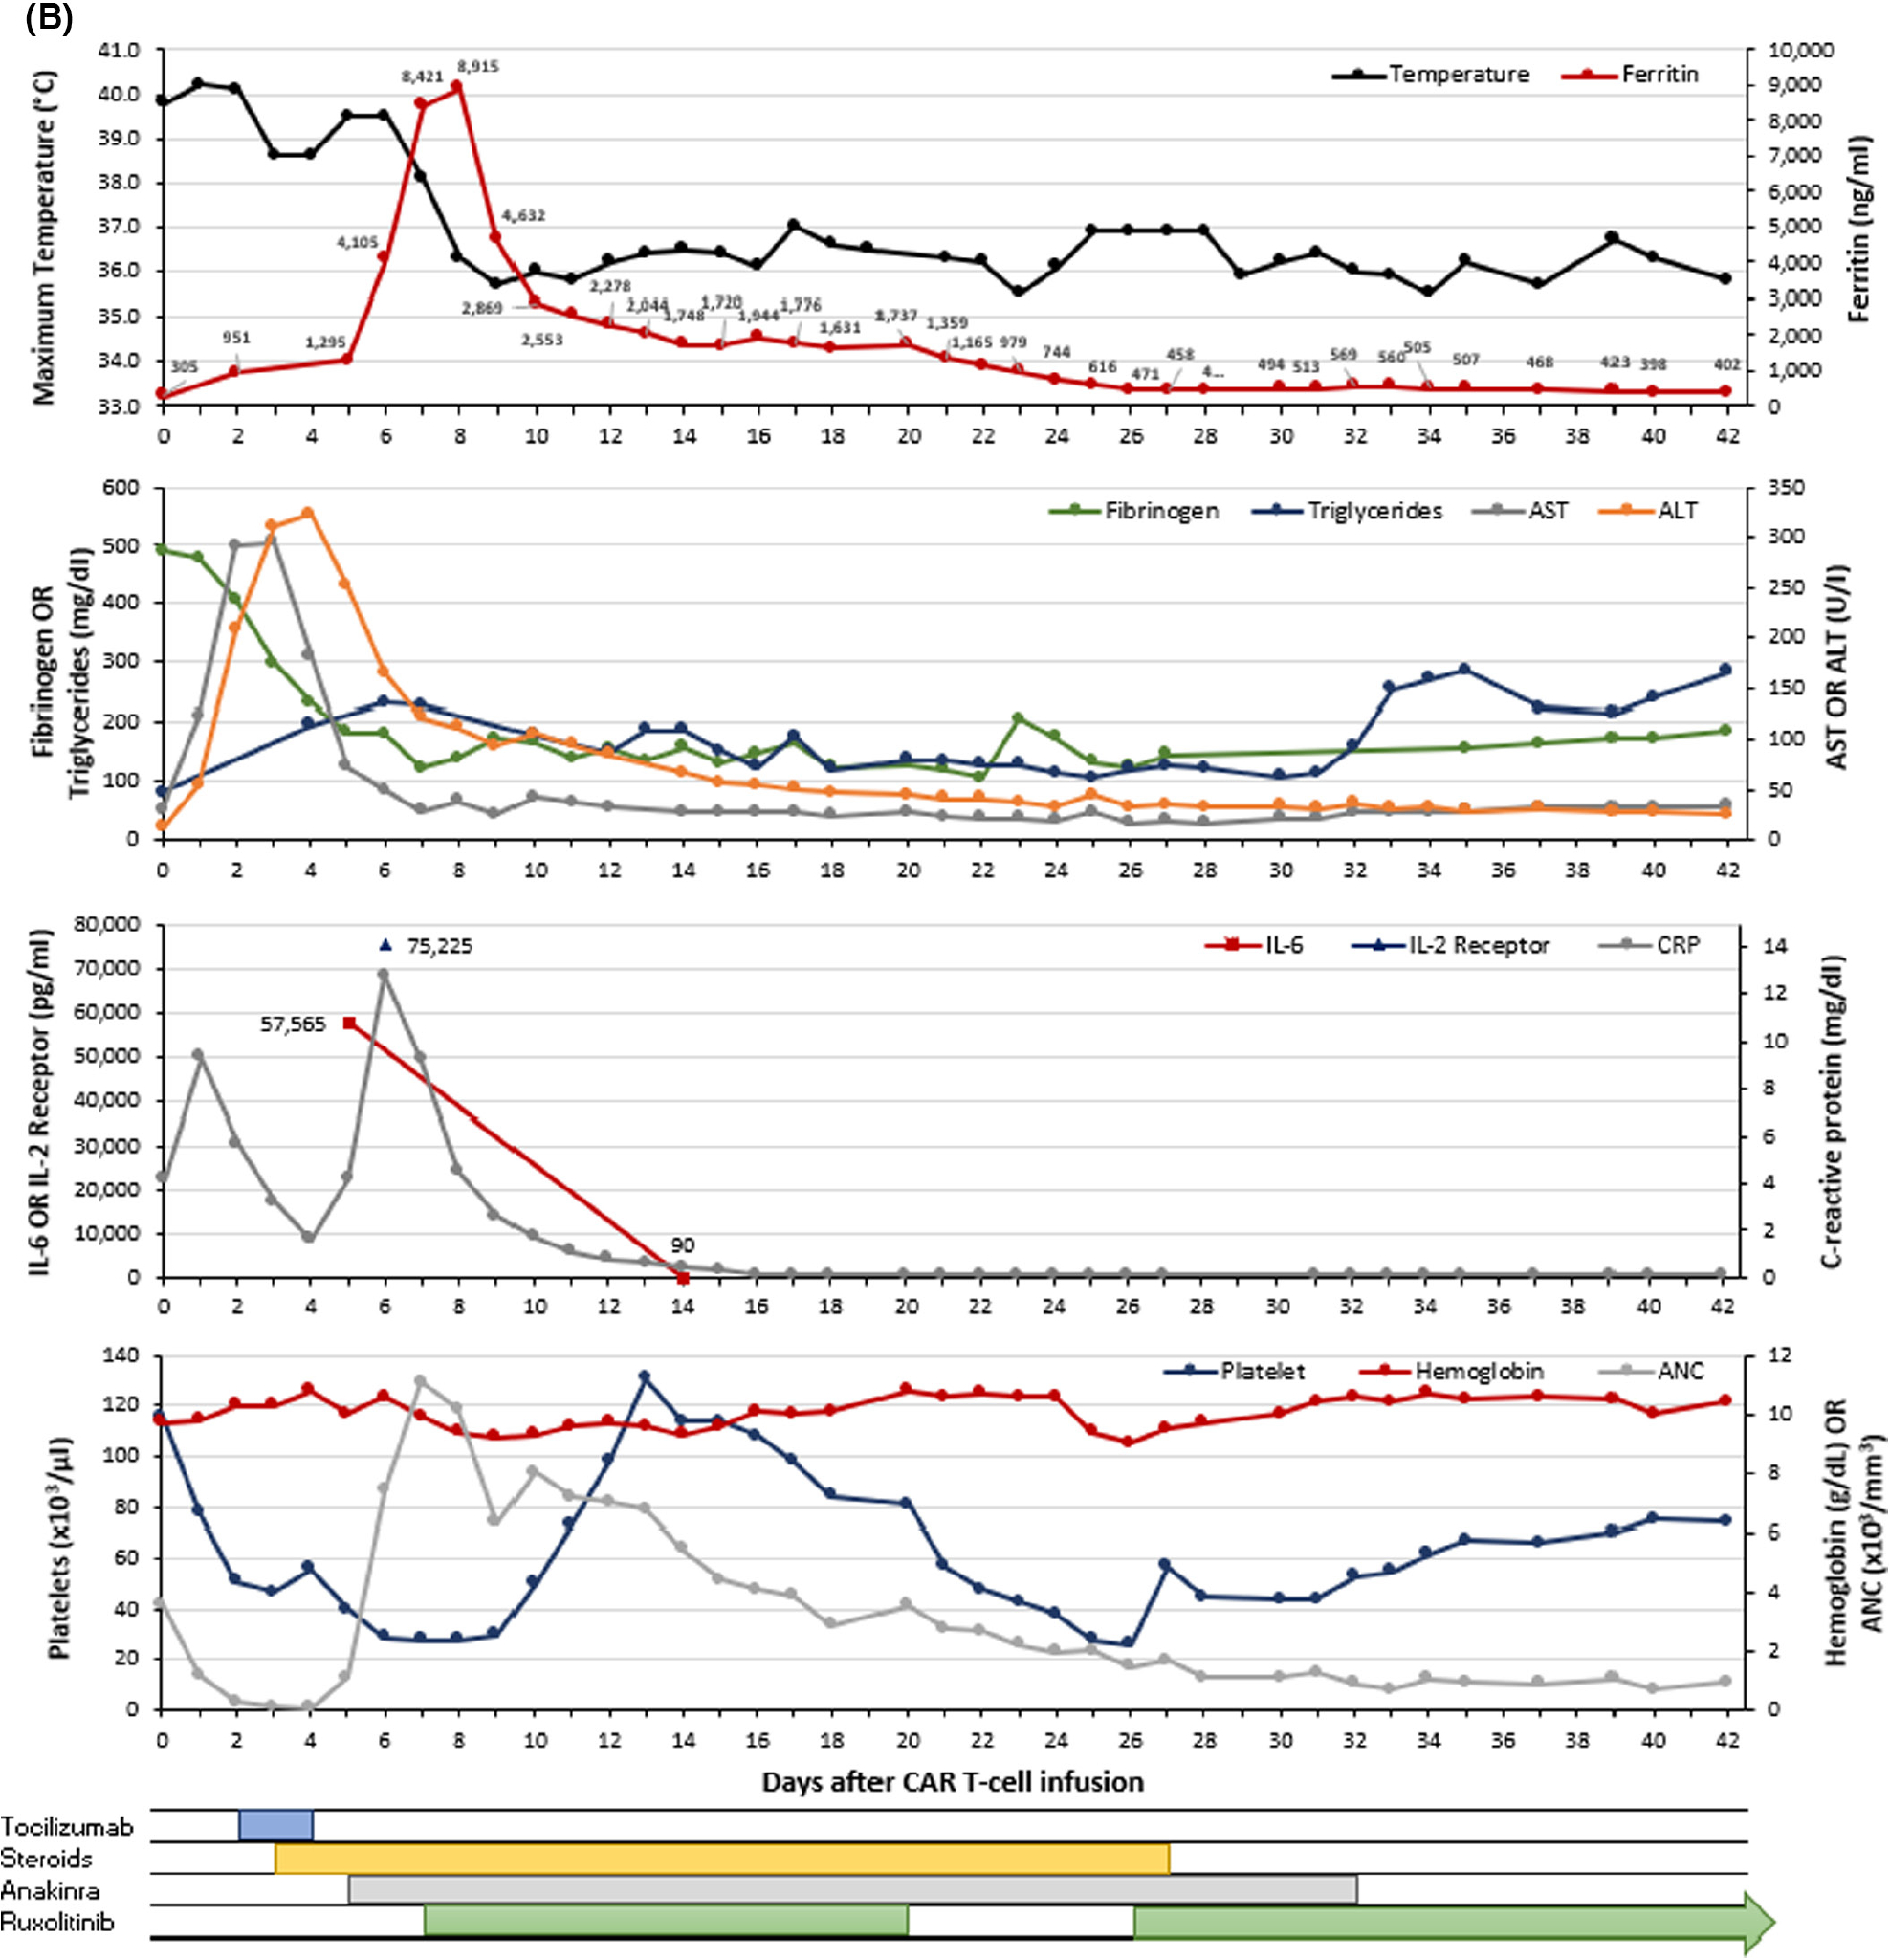
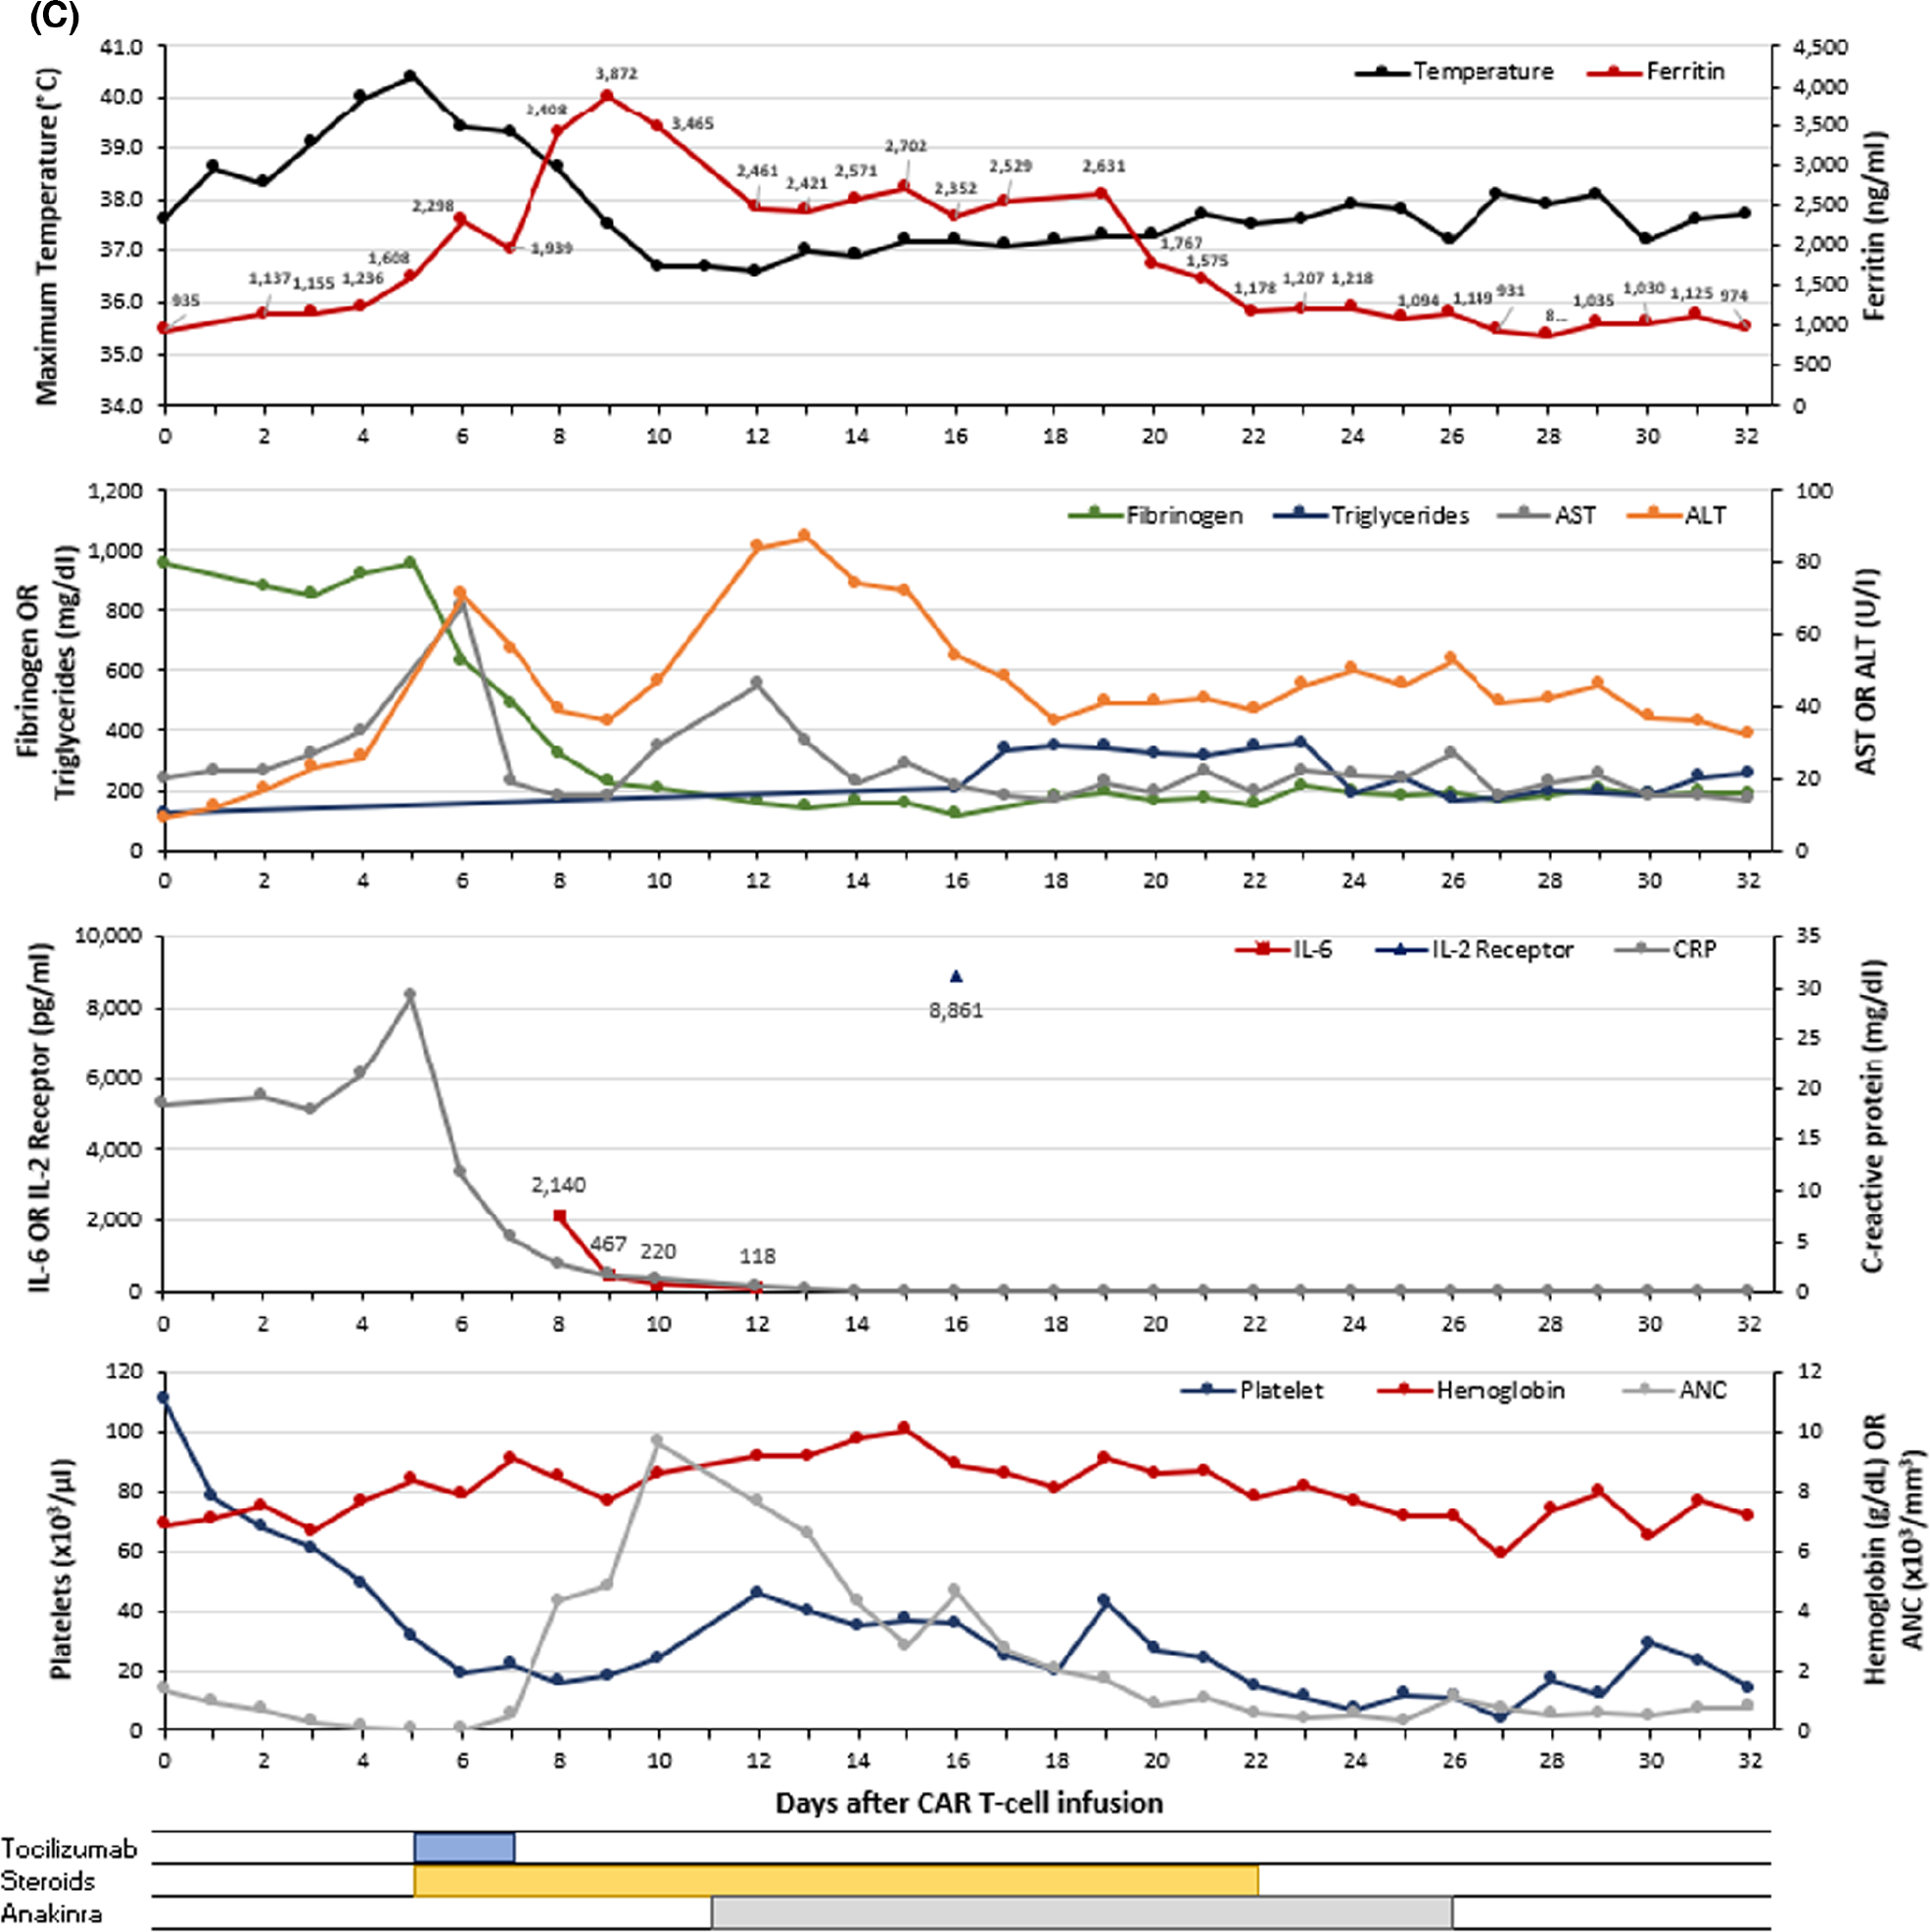
FIGURE 1.


Graphical representation of the clinical course for patients with CAR-HLH after CAR T-cell therapy. Each panel (A–C) represents a unique patient (n = 3). The maximum temperature (black) and ferritin (red) are shown in the first (top) graph for each panel. The second graph presents fibrinogen (green), triglycerides (blue), AST (grey) and ALT (orange). The third graph displays IL-6 (red), soluble IL-2 receptor (blue) and C-reactive protein (grey). The fourth (bottom) graph contains platelet count (blue), haemoglobin (red), and ANC (grey). Therapeutic interventions including tocilizumab, corticosteroids, anakinra, and ruxolitinib are shown below the graphs. Values <0.3 are represented as 0.1 on the graph. ALT, alanine aminotransferase; ANC, absolute neutrophil count; AST, aspartate aminotransferase; CAR, chimaeric antigen receptor; CRP, C-reactive protein; IL-2 receptor, soluble interleukin-2 receptor; IL-6, interleukin-6. [Colour figure can be viewed at wileyonlinelibrary.com]
