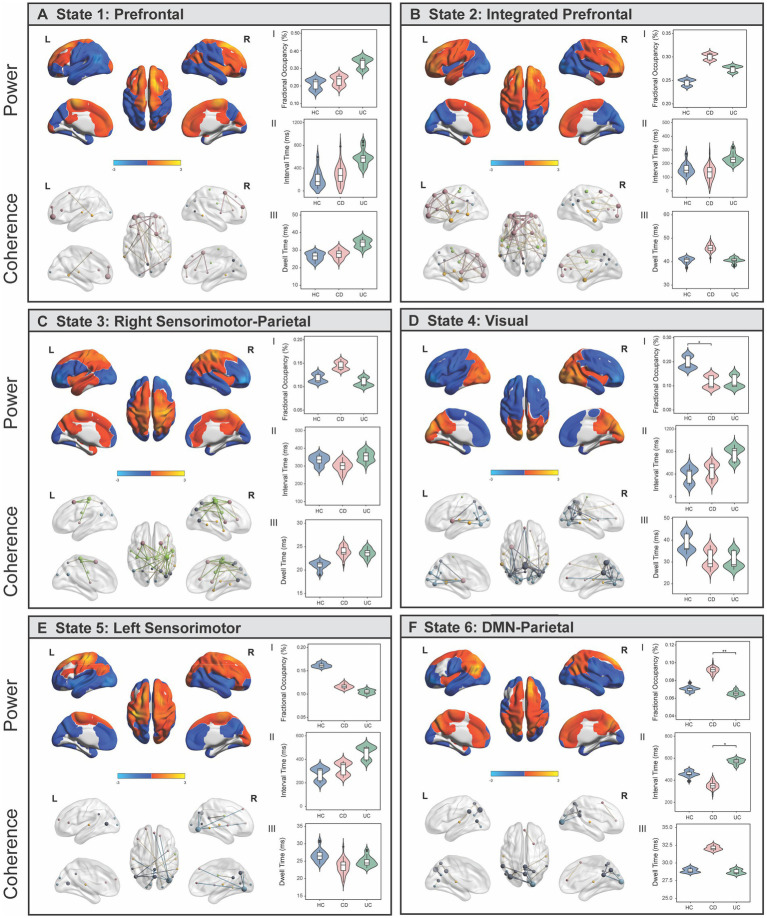
Figure 2.
Brain states identified using Hidden Markov Modelling represent networks of power and spectral coherence. (A-F) Left panel shows wideband (1–30 Hz) power maps (top) and coherence networks (bottom) displayed for each state. Power maps are relative to the state average (z-scored) where blue colours reflect power that is lower than the state average and red/yellow colours reflect power that is higher than the average within that state. Coherence networks show statistically significant (p < 0.01) connections that stand out from a background level of connectivity within that state. Nodes are coloured based on which fMRI association map/s they anatomically correspond to, and the size of each node reflects the centrality (degree) score. (A.I–III) Comparison of temporal statistics between healthy controls (HC), Crohn’s Disease (CD) and Ulcerative Colitis (UC) individuals for each state, after adjusting for age and sex. Fractional occupancy (%) represents the proportion of overall time spent in a state; interval time (ms) represents the length of time between consecutive visits to the same state; and dwell time (ms) is the length of each state visit. Permutation tests were performed to assess the null hypothesis of equality in temporal measures between groups and Tukey’s HSD post-hoc tests were used to identify where significant pair-wise differences were expressed. * denotes pFWE < 0.05; ** denotes pFWE < 0.005.

