Figure 3.
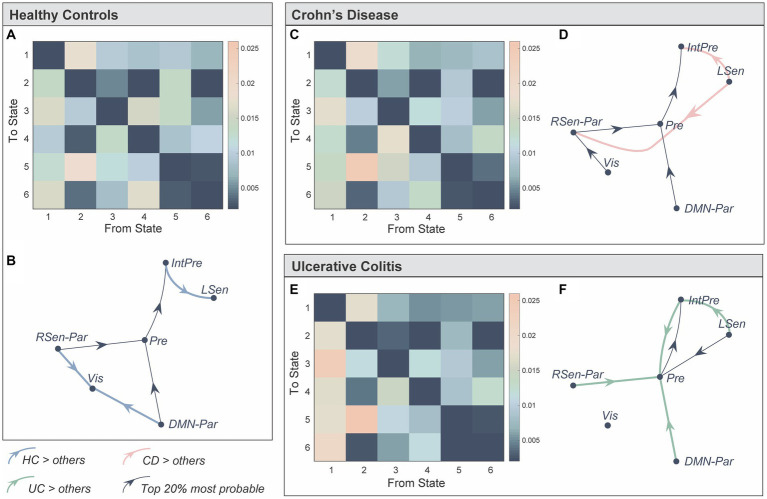
Representation of the transition probabilities between the six brain states in the three groups. (A) We computed subject-specific transition probability matrices representing the likelihood of transitioning from one state, to every other state (K × K). Diagonal matrix elements represent self-transitions (i.e., the probability of remaining in that state) and were set to zero to aid visualisation. (B) Directed transition diagram showing the top 20% most probable state transitions, where each arrow represents a transition. The thin black lines do not represent significant between-group differences, but represent transitions that were more probable on average for that group. Bold, coloured lines indicate a significantly higher probability of this transition in that group. The network-based statistics (NBS) was used to identify significant between-group differences in state transitions (pFWE < 0.05). (C–F) Same as (A,B) but for Crohn’s Disease and Ulcerative Colitis. State 1: Prefrontal (Pre), State 2: integrated prefrontal (IntPre), State 3: right sensorimotor-parietal (RSen-Par), State 4: visual (Vis), State 5: left sensorimotor (LSen), and State 6: DMN-parietal (DMN-Par). Healthy control (HC), Crohn’s Disease (CD), and Ulcerative Colitis (UC).

