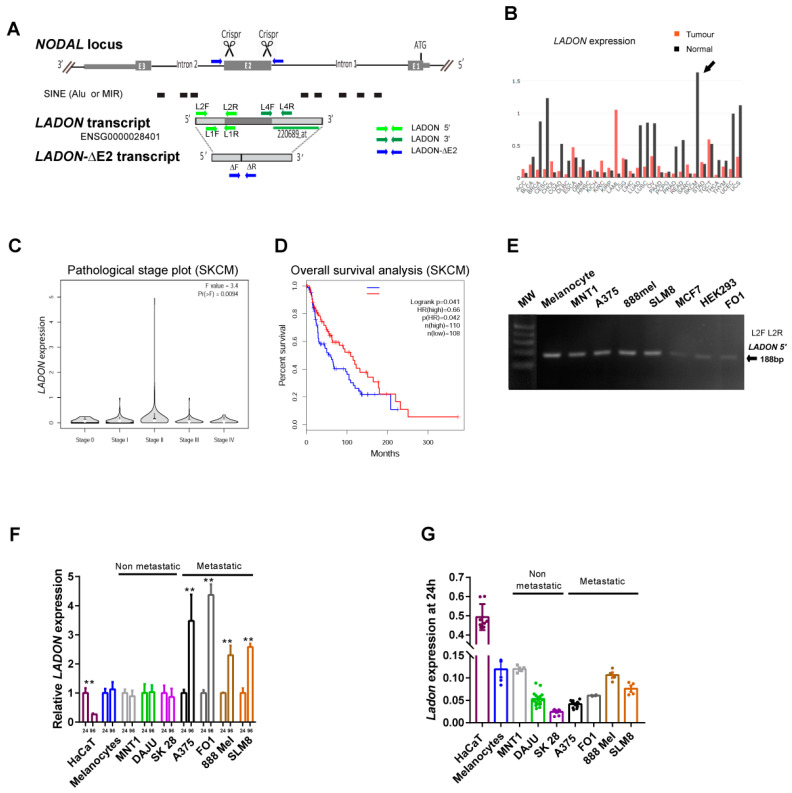
Figure 2.
LADON, a natural antisense transcript of NODAL is a candidate oncogene in human melanoma. (A) Schematic of the human NODAL locus with its 3 exons (E1 to E3), showing the LADON transcript transcribed from the opposite strand below. The truncated LADON-ΔE2 transcript is expressed in A375 cells deleted for the NODAL exon2. The arrows represent the primers used to track these transcripts. The black boxes show the location of short interspersed nuclear elements (SINE), which are mostly Alu and MIR sequences. (B) The bar plot of the LADON expression profile across all tumour samples and paired normal tissue was obtained from TCGA and GTEx data. The height of the bars represents the median expression of tumour types and normal tissues. The tumour abbreviation chart is provided in supplementary Table S1. The arrow indicates the high differential of LADON expression found in skin cutaneous melanoma (SKCM). (C) Pathological stage plot of LADON expression in SKCM. (D) The overall survival plot of SKCM patients with tumours expressing high or low levels of LADON. The hazard ratio (HR) calculation is based on the Cox PH model. (E) The RT-PCR with primers (L1F-L1R) amplifying a 130 nt band from the 5′ regions of LADON detects the transcript in all cell lines of the panel: melanocytes, non-metastatic melanoma (MNT1), metastatic melanoma (A375, 888 mel, SLM8, FO1), breast cancer (MCF7), and an embryonic kidney. (HEK293). (F) The RT-qPCR measurements of the LADON expression were performed in keratinocytes (HaCat), melanocytes, non-metastatic (MNT1, DAJU, SK28) or metastatic melanoma cells (A375, FO1, 888 Mel, and SLM8), after 24 h and 96 h of culture. The LADON expression was normalized to that of endogenous RPL13. For each cell line, the value at 24 h was then set to 1. (G) The RT-qPCR measurements (dots) of LADON expression after 24 h culture were performed on the same panel as in (F) but normalized to the endogenous RPL13 expression. The histograms display mean values ± SD from a minimum of two independent replicates, p-values were calculated using the Student’s t-test, ** < 0.01.

