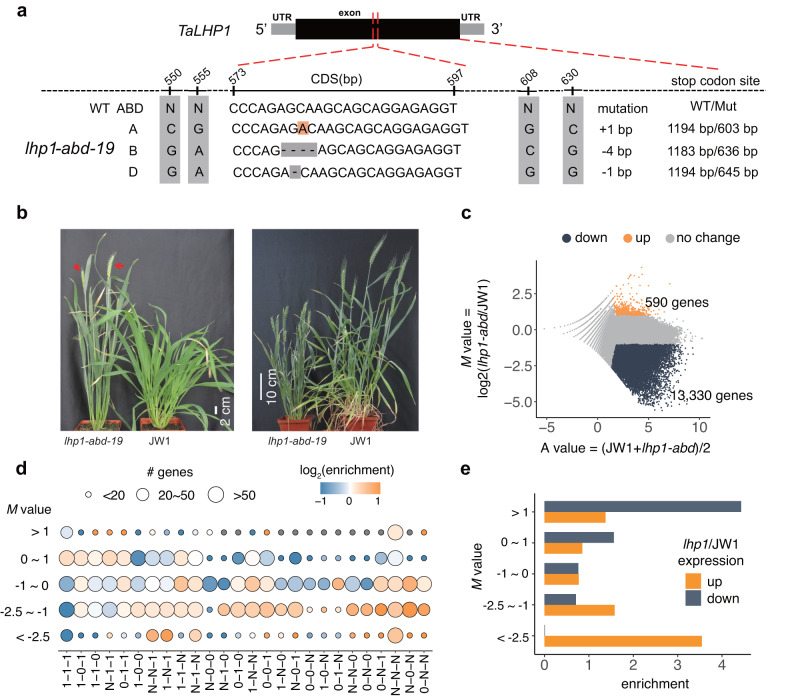
Fig. 2. Direct repression of subgenome-diversified genes by LHP1-mediated H3K27me3.
a CRISPR-editing sites in Talhp1-abd lines. The positions in gray represent the reference SNVs differentiating homoeologs. The region from 573 to 597 is the CRISPR target site. The type of mutation is listed on the right. b Representative developmental phenotypes of the Talhp1-abd mutant. Left: heading under long-day conditions, with red arrows indicating spikes; scale bar, 2 cm. Right: growth at 60 days after planting; bar, 10 cm. c H3K27me3 changes in the Talhp1-abd mutant. The x-axis represents the average read densities in H3K27me3 target genes in the wild-type and Talhp1-abd samples, whereas the y-axis represents the log2-transformed changes (M value) in H3K27me3 in Talhp1-abd. d Enrichment of homoeologous groups among the genes with differential H3K27me3 changes (M value) in Talhp1-abd. Dot colors represent the enrichment score, with all high-confidence genes as the background. e Enrichment of genes with up- and downregulated expression among the genes with differential H3K27me3 changes [represented by M = log2(fold-change)], with all high-confidence genes as the background.

